Design and development of SQC-SAS wearable
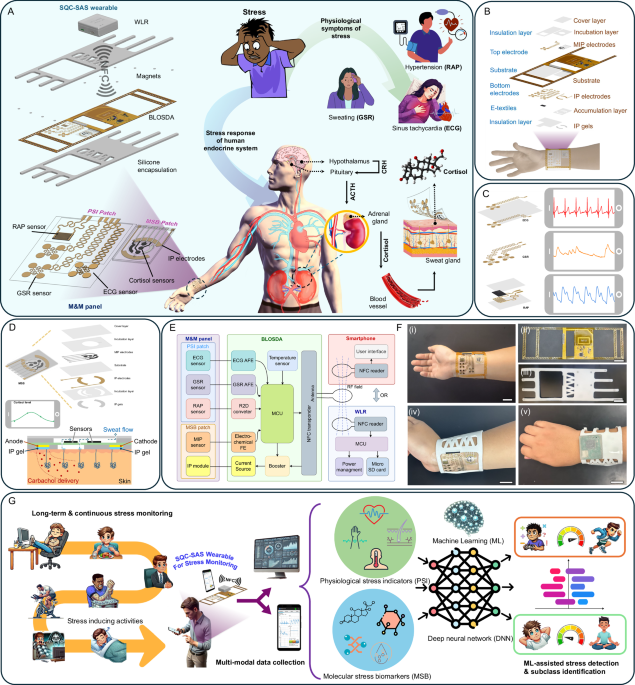
The SQC-SAS wearable bioelectronic comprises three core components as shown in Fig. 1A: (1) The multimodal and multi-sensing (M&M) panel, which includes the PSI patch and MSB patch. This panel features biocompatible, skin-conformal, epidermal, miniaturized, flexible, and stretchable designs, equipped with multiple sensors for the simultaneous collection of multimodal PSI and MSB signals. (2) The battery-less on-skin data acquisition system (BLOSDA) that provides high data throughput for multi-sensor readouts through wireless power and data transmission via near-field communication (NFC). This component acts as the data and energy bridge between the M&M panel and the WLR. (3) The battery-powered WLR, which manages wireless power and data exchange with the BLOSDA system, enables continuous, long-term, on-demand, real-time monitoring and storing data on a microSD card. The PSI sensor patch was constructed using mechanical patterning to build serpentine-shaped electrodes and interconnections on ultrathin (15 µm) gold-coated polyimide (Au/PI) films (Fig. 1B, C). One pair of serpentine electrodes functions as the GSR sensor, while another pair of back-to-back serpentine electrodes serves as the ECG sensor. The RAP sensor is made from a MXene/PANI/PEDOT-based e-textile integrated with interdigitated electrodes (IDE) composed of Au/PI film. The micron-range thickness and serpentine-shaped design of the PSI patch render it flexible, stretchable (up to 94% tensile strain), and epidermal, creating a reliable skin-electrode conformal interface that benefits signal acquisition and ensures the sensors on the PSI patch are comparable to commercial products. The MSB sensor patch contains the electrode arrays modified with molecularly imprinted polymer (MIP) layers, two IP electrodes, and a multi-inlet microfluidic system, as depicted in Fig. 1D. The MIP layers are synthesized through an electro-polymerization process that integrates functional monomers and redox probes, resulting in a precise and selective sensing mechanism. The inclusion of Prussian blue (PB) within the MIP matrix serves as an intrinsic electrochemical signaling probe, enabling rapid, low-voltage biomolecule sensing without the overoxidation issues common in traditional sensors. This approach enhances the reusability and reusability of the sensor. The IP electrodes are loaded with iontophoresis hydrogel (IP gel) to induce sweat autonomously anytime without the need for strenuous exercise. Carbachol gels (Carbagel) are preferred over conventional pilocarpine gels (Pilogel) due to their superior efficiency in sustaining prolonged sudomotor axon reflex sweat secretion, making them optimal for microfluidic sweat sampling. Our study demonstrated carbachol-induced sweat at a rate of 4 µl/min, alongside a high biocompatibility of 96% cell viability, validating its suitability for wearable applications (Supplementary Fig. 1). The mechanically engraved microfluidic system was designed to collect sweat samples induced by IP, preventing contamination and evaporation to enable on-site cortisol level detection.

A Conceptual overview illustrating the physiological impact of stress, the body’s response mechanisms, and the role of the SQC-SAS wearable in monitoring stress-related signals. Stress stimuli trigger inflammatory responses, cardiovascular changes (e.g., heart rate, blood pressure), and sweating, mediated by cortisol release from the adrenal glands into the bloodstream, later diffusing into sweat. The wearable device, positioned on the wrist , comprises (i) the M&M panel, which integrates the PSI patch (for ECG, GSR, and RAP sensing) and the MSB patch (for cortisol detection), (ii) the flexible BLOSDA for signal acquisition from the M&M panel, and (iii) the WLR for continuous data collection and storage. B Layer-by-layer assembly of the M&M panel and its integration with the BLOSDA, detailing the structural organization of the system. The bottom layer contains the skin-contact electrodes for ECG, GSR, pulse sensing, and iontophoresis, while the top layer hosts the MIP electrodes for cortisol detection. C Design and electrode configuration of the PSI patch, highlighting the sensing structures for ECG, GSR, and RAP measurements, along with representative signal patterns from each modality. D Structural design and assembly of the MSB patch within the M&M panel, showing its detailed layer-by-layer composition. This includes the MIP electrode array for cortisol sensing, incubation layers for sweat collection, and a schematic of sweat extraction through wireless iontophoresis for on-demand sampling. E System block diagram depicting the electronic interface between the sensors, BLOSDA, and the WLR or smartphone for real-time data transmission and monitoring. F Optical images of the device components: (i) M&M panel showing the PSI and MSB patches on the wrist, (ii) BLOSDA without encapsulation, (iii) BLOSDA with silicone encapsulation, (iv) integrated M&M panel with encapsulated BLOSDA worn on the wrist, and (v) combined BLOSDA and WLR setup on the wrist (Scale bar: 2 cm). G Schematic illustration of continuous stress monitoring using the SQC-SAS wearable, capturing multimodal PSI and MSB signals to distinguish between rest and stress states, including stress subclasses. The acquired data are processed via a machine learning workflow for accurate detection and classification of stress responses.
The M&M panel was connected to the BLOSDA unit for wireless data acquisition and signal processing, eliminating the need for rigid or bulky wiring to improve the device’s comfort and wearability. As illustrated in the functional block diagram (Fig. 1E), the BLOSDA integrated various key components: analog front-end (AFE) circuits for ECG and GSR signal amplification and filtering, a resistance-to-digital converter (R2D) chip for RAP signal monitoring, an electrochemical front end (FE) for cortisol level detection and sensor restoration , an on-board temperature sensor for body temperature monitoring, a booster with current source for IP, and microcontroller unit (MCU) for analog-to-digital conversion, data processing, communication, and power management. The NFC module on BLOSDA serves dual purposes: it harvests power from the WLR or smartphone to operate the BLOSDA unit, and it enables real-time, wireless high-rate data collection/transmission (up to 40 kbit/s) from multiple sensors on the M&M panel to smartphone or WLR. A custom Android app was developed to visualize monitored signals in real-time on a smartphone, while the WLR is designed to attach directly to the BLOSDA unit, allowing the user to record data to a microSD card hands-free without holding the phone. The BLOSDA unit is encapsulated in skin-compatible silicone, measuring 235 × 73 × 4 mm (including straps), and is designed to be securely fastened to the wrist, as shown in Fig. 1F.
Unlike traditional stress monitoring methods that often rely on costly and bulky laboratory instruments—which are not user-friendly and require skilled personnel to operate or invasive blood tests that are uncomfortable and inconvenient, the SQC-SAS wearable offers a different solution for stress monitoring. Featuring reusable sensors for detecting MSB (cortisol) and an epidermal PSI patch for monitoring PSI signals (ECG, GSR, RAP, and ST), the SQC-SAS wearable provides a rapid, convenient, and non-invasive approach for comprehensive stress assessment. To validate the feasibility of the SQC-SAS wearable for stress monitoring, multi-modal physiological data were acquired during validated stress-inducing protocols, as well as during non-stressful conditions. Our device enables autonomous and continuous in-situ data acquisition, ensuring accurate and consistent stress evaluation (Fig. 1G). To realize stress vs. rest state detection and stressor-type classification, we also employed the Inception-MABFDNN model specifically designed to analyze stress-related patterns across various features extracted from PSI and MSB signals. This advanced machine learning (ML) model significantly improves the accuracy of stress detection and reduces the likelihood of false positives. Together, all the above position SQC-SAS wearable bioelectronic as a feasible solution for continuous and multimodal stress monitoring, offering unparalleled potential for the proactive management of stress and its associated health risks.
Development, design, and validation of PSI patch: ECG, GSR, and RAP sensor
The ECG and GSR sensors within the PSI patch require direct skin contact to capture biopotential and bioimpedance variations41. Flexibility and stretchability are essential for these sensors to maintain conformal contact with the skin, accommodating any movement-induced deformations. To enhance stretchability, the PSI patch design incorporates island structures connected by serpentine-shaped patterns (Fig. 2A). When the PSI patch undergoes stretching, these serpentine ribbons can rotate within the same plane and buckle out of the plane to accommodate the applied deformation, significantly reducing strains42. Also, the island structure enlarges the skin contact area per unit area without enlarging the electrode size, thereby enhancing user comfort and breathability11. Finite element method (FEM) simulations conducted under a 20% applied strain (>skin strain tolerance ≈ 15%43) showed that our island-structured electrodes with serpentine interconnections (Design 1) exhibited a principal strain of only 4.7%, which is below the substrate material fracture strain limit of PI (5.1%44). Additionally, the maximum principal strain in Design 1 is up to three times lower than the strains observed in conventional curved ribbons, measuring 11% and 13% in Designs 2 and 3, respectively (all designs use the same island diameter of 4.32 mm and ribbon width of 250 µm) (Fig. 2C). To experimentally validate our simulation results, we measured the relative resistance change (\(R/{R}_{0}\)) of each electrode design under strain until the ribbons were fully ruptured. Design 3 exhibited the lowest stretchability (16%), followed by Design 2 (33%), with Design 1 demonstrating the highest stretchability (94%) (Fig. 2D). Thus, Design 1 was selected for the ECG and GSR electrodes in the PSI patch and the electrode demonstrated excellent mechanical stability in cyclic bending and stretching tests (Fig. 2E, Supplementary Fig. 2 and Supplementary Note 1). Four-island electrode design was selected to increase the contact area, showing a reduction in electrode-to-skin interface impedance and an increase in SNR up to 20.8 dB compared to designs with fewer islands (Supplementary Fig. 3).

A Illustration of the ECG, GSR and RAP sensors on the PSI patch and the optical image showing the PSI panel attached to skin (Scale bar: 2 cm). B Fabrication process for the ultra-thin Au electrodes using the CPTP method. Mechanical stability assessment of the PSI patch: C FEM simulation of the maximum strain distribution of the 3 electrode designs with different interconnect structures under up to 20% strain. D Experimental verification of the resistance changes of the 3 electrode designs with applied strain, comparing their stretchability. E Relative resistance changes of the PSI panel electrodes during (i) 20% stretching for over 6000 cycles, and (ii) 30% bending for over 30,000 cycles. (Insets: photographs of the electrode during cyclic stretching/releasing and bending/releasing (Scale bar: 2 cm)). F Optical images of the PSI panel mounted on the test stage: (left) the initial state and (right) under 30% strain, showing no visible damage. (Scale bar: 2 cm). G Comparison of the (i) ECG (ii) GSR (iii) RAP signal collected by the PSI patch before and after 10,000 cycles of 30% bending and 2000 cycles of 20% stretching, showing no degradation in signal quality. H On body evaluation of the PSI patch’s skin conformability and mechanical integrity during twisting, compressing, and stretching, showing no noticeable delamination or damage (Scale bar: 1 cm). I Crosstalk study between the ECG and GSR AFE circuits: Simulation results showing the crosstalk effects of (i) 3- and (ii) 2-electrode ECG configurations on ECG and GSR AFE outputs. (Top) Baseline shift in the GSR AFE output caused by crosstalk between ECG and GSR sensors, attributed to the bias voltage on the 3rd ECG electrode. (Bottom) GSR and ECG AFE outputs after mitigating crosstalk by using a 2-electrode configuration for the ECG AFE, enabling simultaneous multi-sensor measurements. J Illustration of the cross-sectional view of the electrode-skin interface along with its equivalent circuit model, including parameter values obtained from experimental measurements. (This diagram represents only a single electrode-to-skin interface.) K Comparison of the skin-electrode interface impedance spectrum between our Au/PI dry and wet electrodes with commercial Ag/AgCl wet electrode demonstrating that our ultrathin dry and wet Au/PI electrodes can achieve lower electrode-skin impedance than commercial wet Ag/AgCl electrode, suitable for long-term measurement. L–N Comparison between the dry PSI Au/PI electrode and commercial wet Ag/AgCl electrode before and after 12 h of usage. (The wet Ag/AgCl electrode partially dries out after 12 h): L skin-electrode interface impedance spectrum and M ECG signals of the same subject collected through the dry PSI Au/PI electrode and commercial wet Ag/AgCl electrode before and after 12 h of usage. N The SNR of the ECG signals in (M), demonstrating the stability of dry Au/PI electrodes for long-term usage (n = 3 technical replicates). Data are presented as mean values ± SD. O Sensitivity of the RAP sensor under 0−340 kPa pressure. P Real-time response of the RAP sensor to applied pressure ranging from 1 to 200 kPa. Q (i) Response time and (ii) Recovery time of the RAP sensor. Mechanical stability tests conducted on the RAP sensor under cyclic pressing with a pressure of 10 kPa and cyclic bending at 30%: R Variations in RAP sensor output responses during pressing and bending over 50,000 cycles (n = 3 technical replicates). Data are presented as mean values ± SD.
The mechanical stability of sensors is essential for wearable devices to ensure they withstand mechanical deformations while preserving functionality. We evaluated Design 1’s island-serpentine structure for stability using cyclic strain tests, subjecting it to strains from 0 to 20% at a 0.5 Hz frequency. Over 6000 cycles, the normalized resistance change remained under 2%, as shown in Fig. 2E(i), confirming the design’s resilience under mechanical stress. Additionally, cyclic bending tests simulated natural skin curvature by bending the electrode from 0% to 30%, revealing similar resistance stability after 30,000 cycles (Fig. 2E(ii)). By incorporating the serpentine structure into the connections, the entire PSI patch achieved enhanced stretchability and exhibited no damage under a 30% strain, as demonstrated in Fig. 2F. As illustrated in Fig. 2G, a comparative analysis was performed on the ECG, GSR, and RAP signals collected by the PSI patch before and after it underwent 10,000 cycles of 30% bending and 2000 cycles of 20% stretching. The analysis revealed that there was no noticable degradation in signal quality subsequent to testing, thereby affirming the superior mechanical performance of the PSI panel. In addition, an on-body assessment was conducted to evaluate the PSI patch’s skin conformability and mechanical integrity under various deforming conditions (Fig. 2H), such as twisting, compressing, and stretching. This assessment verified that the patch exhibited neither any noticable delamination nor any other form of damage, thus highlighting its robustness and suitability for dynamic wearable applications. Given that both the ECG and GSR sensors are in direct contact with the skin, the conductive properties of the human body facilitate a circuit path between the two signals, necessitating careful consideration to prevent crosstalk. To address this, the bias of the ECG AFE was disabled, and a single-lead ECG configuration was employed. This setup not only minimizes crosstalk between the ECG and GSR signals but also enhances user convenience, as detailed in Fig. 2I and Supplementary Note 2.
Another critical factor in ECG and GSR electrode design is the electrode-to-skin interface impedance, which affects SNR. Traditionally, conductive gel is applied to reduce impedance and improve signal acquisition45; however, this method suffers from increasing impedance over time due to gel solvent evaporation during prolonged measurements. Our ultra-thin electrodes with serpentine connections are made from a 15 µm thick Au-coated PI film, which is thin enough (46) to self-adhere to the skin surface via Van der Waals forces and form epidermal contact. We developed a cut-peel-transfer-peel (CPTP) method for low-cost rapid fabrication of conformal and stretchable ultra-thin electrodes (Fig. 2B) without the need for microfabrication. This design provides a lower skin-to-electrode contact impedance without conductive gel compared to commercial wet Ag/AgCl electrodes when applied to the skin (Fig. 2K). We hypothesize that the observed phenomenon is due to the excellent adaptability of the PSI’s Au/PI electrodes, which closely conform to the microscopically uneven surface of the skin. To elucidate this interaction, we have developed a cross-sectional schematic detailing the comprehensive electrode-skin interface. As depicted in Fig. 2J, the skin is modeled as a simplified three-layer structure comprising the epidermis, dermis, and hypodermis, with eccrine sweat glands embedded within the dermis and extending to the epidermal surface via sweat ducts. The PSI Au/PI electrodes are designed to match the undulating contour of the epidermis, effectively minimizing air gaps between the Au and the skin. Based on this model, Fig. 2J presents an equivalent circuit starting with the connections from Au/PI to the various skin layers, which aids in identifying the key components influencing the electrode-skin interface impedance. Direct contact at the Au-skin interface is represented with parallel contact resistor RC, Au, and contact capacitor CC, Au. The stratum corneum within the epidermis is depicted with a parallel resistance and capacitance model (Rsp and Csp), while the dermis and hypodermis are modeled as a resistor (Rtissue). Estimated values of these parameters are derived from measured skin-electrode contact impedance spectra and are listed in Fig. 2J. To further highlight the advantages of the dry PSI Au/PI electrode, we demonstrate its ability to maintain lower contact impedance compared to commercial Ag/AgCl gel electrodes, making it more suitable for long-term measurements. Figure 2L compares the contact impedance of both the dry PSI Au/PI electrode and the commercial Ag/AgCl gel electrode before and after 12 h of usage. The dry PSI Au/PI electrode exhibited negligible changes in skin-electrode contact impedance, whereas the commercial Ag/AgCl gel electrode displayed increased impedance over time due to gel dehydration. Additionally, we assessed the ECG signals collected with these electrodes (Fig. 2M). The results indicate that the increased impedance in the commercial electrode led to a decreased SNR, while the PSI Au/PI electrode showed no noticable degradation in ECG signal quality (Fig. 2N).
The RAP sensor within the PSI patch needs to detect sub-kilopascal pressure variations induced by the RAP, which is achieved by our resistive pressure sensor. The sensor comprises an e-textile laid over IDE, which is sandwiched between insulation and substrate layers (Fig. 2A). E-textile was made by coating conductive material on a woven fabric. This design relies on the working principle that the inter-contact area within the woven mesh structure of the e-textile expands under pressure, establishing more conductive pathways and thereby enabling RAP monitoring through conductance changes47. Cotton fabric was chosen for e-textiles not only for its woven mesh structure but also for its flexibility, lightweight, cost-effectiveness, and ease of coating. The MXene/PANI/PEDOT composite was selected specifically for its ability to enhance the textile’s conductive properties while maintaining flexibility and durability essential for wearable applications. This composite leverages the complementary properties of MXene, PANI, and PEDOT, achieving superior conductivity and mechanical resilience. MXene/PANI/PEDOT was synthesized as the conductive material due to the interaction between MXene, PANI, and PEDOT, driven by π-π bonding and electrostatic forces, enhancing conductivity48. Raman spectroscopy was also performed and confirmed the successful synthesis of MXene, PANI, PEDOT, and the MXene/PANI/PEDOT composite (Supplementary Fig. 5). Additionally, SEM images of the e-textiles show that the MXene nanosheets, PANI, and PEDOT uniformly adhered to the cotton fabric surface via the dip-coating method (Supplementary Figs. 4 and 5). The e-textile coated with a 1:1:1 ratio of these materials resulted in optimal conductance of 1.4 × 10⁵ S compared to other combinations (Supplementary Fig. 5 and Supplementary Note 3). The IDEs under the e-textile carry the excitation signal from the BLOSDA to the e-textile, enabling the conversion of applied pressure into an electrical signal. The sensitivity of our resistive-based RAP sensor was evaluated by applying a constant excitation voltage and monitoring the relative current response (\(\Delta I/{I}_{0},\Delta I=I-{I}_{0}\)) while applying external pressure (\(P\)) ranging from 0 to 340 kPa. The sensitivity of the RAP sensor (\(S\)) is calculated as \(S=\left(\Delta I/{I}_{0}\right)/\Delta P\). The sensitivity of the sensor varies across pressure ranges, showing values of 6.30, 4.55, and 3.14 kPa−1 for the ranges 0–100, 100–200, and 200–340 kPa, respectively (Fig. 2O). The reduction in sensitivity at pressures above 100 kPa is attributed to the densification of voids within the e-textile49. Nonetheless, the results indicate that the sensor’s sensitivity across all evaluated pressure ranges remains sufficiently high for effective RAP sensing. The sensor’s repeatability was tested by applying constant pressures from 1 kPa to 200 kPa over five cycles, with results indicating a stable and repeatable relative current response at each pressure level (Fig. 2P). The MXene/PANI/PEDOT-based RAP sensor shows a rapid response time of 62 ms and a recovery time of 57 ms, sufficient for real-time RAP monitoring (Fig. 2Q). The RAP sensor demonstrated high mechanical stability and flexibility, maintaining consistent performance with 2R, Supplementary Fig. 6, and Supplementary Note 3).
Assessment, characterization, and optimization of the MSB patch
The design and fabrication of the MSB sensor patch within the SQC-SAS wearable involves careful selection of the substrate and electrode materials to ensure optimal performance for on-skin applications. The substrate for the MSB sensor patch was fabricated using SEBS, selected for its excellent biocompatibility with human skin and mechanical properties closely resembling those of Tegaderm tape, the substrate used for the PSI patch (Supplementary Fig. 7A). SEBS exhibits a Young’s modulus closely matching that of human skin (0.1–2.4 MPa)50 and offers exceptional flexibility and stretchability of up to approximately 500%. This significantly outperforms commonly used materials in flexible devices, such as polyimide (PI) and polyethylene terephthalate (PET), which have substantially higher Young’s moduli and lower fracture strains (PI: 2.23 GPa, 50%; PET: 2.79 GPa, 70%, respectively)51, making SEBS a more suitable choice for conformal and stretchable wearable applications. While the MSB substrate gains stretchability from SEBS, the MSB electrodes must also be stretchable, durable under bending and stretching, and remain conductive. To meet these requirements, we combined Ag with SEBS, producing flexible and conductive electrodes with an electrical conductivity of 104 S/cm (Supplementary Fig. 8). Next, MIP layers were integrated into electrode arrays of the MSB sensor patch for their ability to replicate the binding properties typically associated with antibodies or enzymes, enabling precise detection of targeted sweat cortisol molecule levels with exceptional sensitivity and selectivity52. A major challenge in developing MIP-based sensors is achieving environmental stability, restoration, and reusability for continuous, real-time monitoring in a wearable format. Some recent approaches have involved off-site sensor restoration using specific washing solutions53. However, this method risks compromising the MIP structure, potentially causing polymer swelling, shrinking, or loss of functional groups, which can reduce the sensor’s selectivity and affinity for target molecules54. Additionally, using external wash buffers is impractical for wearable applications. In our research, we addressed these challenges by designing MIPs for restoration without the need for external washing solutions. This was achieved by applying an overpotential voltage through the electrochemical chronoamperometry (ECA) technique. MIPs typically face overoxidation issues at higher potentials, resulting in the formation of functional groups55 that could adversely affect their structure and limit their reusability56. To overcome this problem, we used pyrrole as a functional monomer for MIP synthesis. During polymerization, these reactive species of monomer underwent electrophilic substitution reactions, forming covalent bonds between the targets. This approach ensured that after polymerization, the functional groups of MIPs became embedded within the polymeric structure on the electrode arrays of the MSB. Subsequent extraction of the target molecules revealed binding sites or imprinted cavities on the MIP-modified electrode that were designed to be complementary in terms of size, shape, and charge to the target analyte, thus achieving highly selective detection of the target analyte (Fig. 3A). In contrast, non-imprinted polymer (NIP) layers lack these binding cavities and are not affected by the presence of target biomolecules. We examined the surface morphology through SEM to verify the formation of imprinted cavities in the MIPs. The SEM images reveal the presence of pores within the MIP layer and the absence of pores on the NIP surface (Fig. 3B, C inset). Further, the quantification of cortisol molecules in sweat relies on measuring the oxidation of target molecules bound to the MIP template using ECA. The current observed in the ECA measurement directly correlates with the concentration of the target analyte. We investigated the detection of biomolecules in a phosphate-buffered solution (PBS) solution at various concentrations using the MSB’s electrode array. To achieve this, we prepared different concentrations of cortisol molecules individually in a 0.1 M PBS solution, ranging from 1 nM to 10 µM, encompassing the physiological range found in sweat36. Subsequently, we utilized the fabricated MIP and NIP-modified MSB electrode arrays to examine the various concentrations of the cortisol molecules (Fig. 3B, C). When employing the MIP-modified MSB’s electrode arrays for cortisol detection, we observed a linear decrease in current response concerning the logarithmic concentration of cortisol (Fig. 3D), achieving a sensitivity of 0.2447 µA/log[nM] and a high correlation coefficient (R² ≈ 0.993). This decrease in current on the MIP-modified sensor indicates the specific binding of cortisol molecules within the imprinted cavities. This specific binding inhibits the electron transfer pathways of PB, leading to a reduction in PB oxidation current. This variation in current was further corroborated using cyclic voltammetry (CV) (Supplementary Fig. 9). The integration of the PB redox transducer into the imprinted polymer and the tuning of experimental settings allow for rapid, wearable ECA biomolecule sensing at a low voltage of +0.1 V, as determined by CV. In contrast, the control experiment utilizing NIP (Fig. 3D) exhibited a negligible response across the same cortisol concentration range, with a sensitivity of only ~0.005 µA/log[nM]. These results indicate the absence of biomolecule-binding cavities within the NIP layer. As depicted in Supplementary Fig. 10 and Supplementary Note 4, to determine the optimal incubation time that allows cortisol binding to the MIP layer, we tested incubation periods from 5 s to 5 min. Using a 100 nM cortisol solution and ECA measurements at +0.1 V, we observed a rapid decrease (~50%) in current as incubation time increased, indicating increased cortisol binding. This response stabilized after 1 min, establishing it as the minimum incubation time for all subsequent measurements (Supplementary Fig. 10A). Selectivity is another vital factor in obtaining accurate results from sweat samples. The MIP-modified MSB’s electrode arrays not only provide selective detection of target biomolecules but also efficiently discriminate against a wide range of common sweat components that may interfere during the transduction process. Figure 3E demonstrates the sensor’s current response after incubation with various common interfering species of progesterone and cortisone at 1 µM concentration in PBS and subsequent introduction of the corresponding 1 µM cortisol molecules in PBS. The MIP sensor exhibited a distinctive response to cortisol, suggesting highly selective detection even in the presence of an excess of potential interfering species, where no response was observed when only interfering species were present. To further assess our sensor’s applicability, we evaluated the performance of the MIP sensor in an AS environment. An artificial sweat (AS) solution with varying cortisol concentrations (1 nM to 10 µM) was prepared to simulate real conditions and test the sensor’s capability to detect cortisol in sweat samples (Supplementary Fig. 10B). The resulting current response displayed a linear relationship with the logarithm of cortisol concentration (Supplementary Fig. 10C), with a sensitivity of 0.24 µA/log [nM] (R² ≈ 0.99), closely matching the PBS results.

A Schematic of the PPy-MIP preparation procedure on SQC-SAS wearable’s MSB electrodes. ECA response of the MIP (B) and NIP (C) cortisol sensor to different cortisol concentrations (1 nM–10 µM) in PBS. (Insets: SEM images of MIP and NIP, respectively (Scale bar: 5 µm); n = 3 technical replicates). D Corresponding calibration plots of the MIP (red) and NIP (blue) cortisol sensors in PBS. MIP sensor shows a logarithmic response of the electrode current to the cortisol level. E Selectivity of the MIP cortisol sensor, demonstrated by the ECA responses of the sensor to 1 µM cortisone, progesterone, and cortisol in PBS, highlighting its specificity for cortisol detection (n = 3 technical replicates). Data are presented as mean values ± SD. F Illustration of the device’s restoration capability, enabling the reuse of the sensor. G ECA response of the MIP cortisol sensor before and after the restoration process measured in PBS. (Inset: Optimization of the restoration process showing the time taken by the different voltammetry techniques (CV, DPV, ECA, and LSV) to reach 100 % recovery; (n = 3 technical replicates). Data are presented as mean values ± SD. H ECA response of the MIP cortisol sensor to same cortisol concentration in PBS after multiple restoration showing the reusability of the sensor. I Demonstration of the restoration and repeated sensing of the same cortisol concentration in PBS using the same MSB sensor multiple times, highlighting the sensor’s reusability and stability. J Batch-to-batch consistency of restored MSB sensors from three separate batches, each containing three sensors (n = 3 technical replicates), demonstrating reliable and reproducible sensing of the same cortisol concentration. K Schematic illustration of cortisol biomolecule detection and restoration processes using MIP. ECA measurement of MSB sensor from lower to higher concentration (L) and higher to lower concentration (M) of cortisol in PBS. N Optical images of the MSB patch demonstrating its flexibility (Scale bar: 1 cm). O ECA response of the MSB sensor during 1000 cycles of 30% bending (Inset: Optical image showing the flexibility of the MSB sensor under 30% bending (Scale bar: 2 cm)). P Bar plots showing the corresponding relative signal retention over 1000 cycles. Q SEM image of MIP working electrode (Scale bar: 3 µm; n = 3 technical replicates) (i) before and (ii) after the 1000 bending cycles test. R (i) Illustration of the long-term environmental stability of the MSB sensor. (ii) Experimental results demonstrating the environmental stability of the MSB sensor, showing more than 96% retention of current response over a 3 weeks testing period (n = 3 technical replicates). Data are presented as mean values ± SD. S Effect of sample volume on the ECA response and relative output current (inset; n = 3 technical replicates) of the MSB cortisol sensor. T Overlaid ECA response and output current (inset) of five independent MSB sensors (n = 5) responding to 10 nM cortisol, demonstrating sensor-to-sensor reproducibility. U Illustration of the sweat sample collection process using the NFC-powered wireless IP system of the SQC-SAS wearable. V Simulated effect of microfluidic inlet number on channel refreshing rate at different time stamps. W Illustration of the microfluidic channel during off-body flow test for sample refreshing and the on-body validation of IP sweat stimulation and sweat sampling. X (i) Optical image of a microfluidic channel where the old sample with red dye is refreshed with the new sample with blue dye (Scale bar: 5 mm). (ii) Optical image of the wireless IP sweat-inducing and collection using the MSB patch. MIP electrodes were removed, and dyes were added to the sample reservoir to aid in the visualization of sweat flow (Scale bar: 5 mm).
The primary challenge in modern sensing technologies for wearable, long-term monitoring is sensor reusability (Fig. 3F). To address this, we developed a restoration process designed to restore the initial current value after removing all immobilized biomolecules adhering to the MIP matrix(Fig. 3K). We began by optimizing the restoration process through an evaluation of various electrochemical voltammetry methods, including differential pulse voltammetry (DPV), linear sweep voltammetry (LSV), ECA, and CV, to identify the method capable of achieving a complete background current recovery ratio in the shortest possible time. As shown in Fig. 3G inset, ECA demonstrated the best performance in terms of restoration time, achieving a full recovery ratio in approximately 55 s, whereas other methods required 80–130 s. Consequently, ECA was chosen for subsequent restoration experiments. Figure 3G shows the current response of the MIP sensor to different conditions: background (PBS without cortisol), sensing signal (PBS with 100 nM cortisol), and post-restoration (PBS without cortisol again). The complete recovery of the background current after restoration confirms the sensor’s capability for multiple reuses, validating the effectiveness of the restoration process. To confirm the repeatability of our restoration process, we evaluated the reusability of our MIP sensor across multiple restoration cycles. As illustrated in Fig. 3H, I, the ECA results from the reused MSB electrode arrays demonstrate reliable sensor performance after ten restoration cycles. The sensors exhibited consistent current signals when exposed to the same sample, with a relative standard deviation (RSD) of less than 5%, underscoring the robustness of the restoration process and sensor reusability. Supplementary Movie 9 demonstrates the ex-situ restoration process of the reusable MSB patch for continuous cortisol measurement in AS samples, using the same sensor and delivering accurate, repeatable results across several consecutive measurements. To assess the repeatability and reliability of the MIP sensor fabrication process, we conducted a batch-to-batch consistency analysis. Specifically, we fabricated three batches of MSB electrode arrays and evaluated the current response of each batch to cortisol molecules in 0.1 M PBS at a concentration of 100 nM. As shown in Fig. 3J, all batches exhibited consistent signals with an RSD of less than 3%, demonstrating the repeatability of our fabrication process. We further validated the repeatability of our MIP sensor by measuring its current response across a range of cortisol concentrations in PBS, from blank (0 nM) to 10 µM, in both ascending and descending orders. As shown in Fig. 3L, M, the MIP sensor consistently provided accurate detection of cortisol across this broad concentration range, demonstrating its stability and precision across different concentration sequences.
Ensuring mechanical stability is also essential for the reliability of skin-worn sensors, particularly under bending deformations encountered during wear (Fig. 3N). To evaluate the impact of bending on sensing performance, the MSB sensor was subjected to 30% cyclic bending for up to 1000 cycles (Fig. 3O). After every 250 cycles, the ECA signal of the MSB sensor in the same buffer solution was measured and the results revealed a high retention rate of approximately 98.3%, demonstrating the device’s resilience and consistent functionality under mechanical stress (Fig. 3P). The SEM images shown in Fig. 3Q and Supplementary Fig. 11 show no visible signs of peeling, cracking, or delamination of the MIP and Ag reference electrodes before and after the 1000 cyclic bending cycles. Long-term stability is another crucial factor in wearable sensors’ practical applications. The MSB electrode array was evaluated for long-term stability over a 3 weeks period under ambient conditions (Fig. 3R and Supplementary Note 4). Notably, variations in sample volume (0.075–0.375 μl/mm²) did not produce substantial changes, as depicted in Fig. 3S. This stability makes it possible to achieve accurate cortisol detection even with low sweat volumes. Furthermore, MSB sensors within the same batch showed highly reproducible results, with an RSD of less than 2%, further confirming the robustness of the fabrication process (Fig. 3T and Supplementary Note. 4).
The integration of the MSB electrode array with a microfluidic channel and a wireless IP system enables on-demand sweat management and in-situ cortisol detection. The use of carbachol iontophoresis gel was first confirmed to be both biocompatible and effective for sustained sweat secretion, making it highly suitable for continuous wearable applications (Fig. 3U, Supplementary Fig. 1 and Supplementary Note 4). The microfluidic design allows for efficient low-volume sampling and precise separation of sweat sampling areas from IP gels, minimizing contamination and preventing sample evaporation. As illustrated in Fig. 3U the wireless IP system can be remotely controlled and powered by a smartphone and WLR, providing a fully wearable sweat stimulation solution, unlike existing market alternatives that require an external power source. For this, firstly, we employed numerical simulations to optimize the microfluidic channel’s design, including the arrangement of inlets, as this impacted sample collection and refreshing efficiency (Fig. 3V, Supplementary Fig. 12 and Supplementary Note 5). The simulation results underscored the enhanced refreshment rate associated with an increased number of inlets. Thus, we used a 4-inlet microfluidic channel for subsequent experiments. The functionality of the microfluidic channel was further validated through both in vitro and in vivo flow tests (Fig. 3W, X). As demonstrated in Supplementary Movie 1, the empty top incubation channel was completely filled with fresh samples from the bottom accumulation layer during the in vitro flow test without any bubble formation, confirming its efficient fluid dynamics. Additionally, another in vitro flow test (Fig. 3X(i) and Supplementary Movie 2) showed that a channel previously filled with an old sample was refreshed with a new sample in 300 s, ensuring complete sample replacement. The in vivo flow test was performed alongside the verification of the IP system, which plays a crucial role in enabling sweat stimulation wirelessly. By eliminating the need for external power sources or batteries, the wireless IP system enhances the device’s portability and usability. To validate its functionality within the MSB sensor patch, an experiment was conducted to assess its capability to stimulate and sustain sweat production for real-time biochemical monitoring. For this, an MSB panel without MIP electrodes was used, and blue dye was placed in the sensing chamber. The MSB sensor patch was then connected to the BLOSDA and attached to a subject’s hand. By positioning a mobile phone near the NFC antenna of the BLOSDA system, the wireless IP was activated, delivering the IP current for 5 min. The chamber’s 8.4 μL capacity filled with sweat in the next 5 min, flushing out the blue dye, as shown in Fig. 3X(ii) and Supplementary Movies 3 and 4. This experiment demonstrated the wireless IP system’s effectiveness for localized, on-demand sweat induction and sampling, underscoring the MSB sensor patch’s capability for continuous molecular sensing.
In vivo verification of the M&M panel
To confirm that the sensors on the M&M panel can reliably provide biosignals for subsequent stress analysis, we assessed the device’s performance on human subjects. Figure 4A displays the on-body ECG signals captured using the PSI patch, highlighting the extraction of key morphological features, the PQRST complex57, depicted in Fig. 4B. Similarly, Fig. 4C, D presents the on-body GSR signals obtained with the PSI patch, illustrating the extraction of essential morphological features, specifically the Tonic and Phasic components58. Figure 4I, J details the RAP signals measured from the human wrist using the RAP sensor, featuring an enlarged view of a single pulse cycle that distinctly captures critical morphological characteristics, including P-, T-, and D- waves59. These results demonstrate that the sensors on the M&M panel exhibit high sensitivity and precision, providing informative biosignals that enable the successful extraction of critical features necessary for training ML models to accurately classify stress events. The dynamic monitoring of cortisol level variations throughout daily activities and the rapid assessment of cortisol responses to stimuli are crucial for evaluating both chronic and acute stress levels in individuals. To demonstrate the practical application of the MSB patch for long-term, on-site, near real-time, and semi-continuous analysis of sweat cortisol levels, we conducted an in situ proof-of-principle study focusing on cortisol circadian rhythms.

A Real-time ECG signal obtained from the PSI patch. B The P, Q, R, S, T peaks of the ECG waveform and RR-interval, showing the ability to accurately capture corresponding signal patterns. C Real-time GSR signal obtained from the PSI patch. D The Tonic (SCL) and phasic (SCR) components of GSR signal extracted from (C). E The comparison between the ECG signals collected by the SQC-SAS wearable and commercial ECG sensor. F The Bland–Altman plot showing the correlation between the HR analyzed from the ECG signals collected by the SQC-SAS wearable and commercial ECG sensors. G The comparison between the GSR signals collected by the SQC-SAS wearable and commercial GSR sensor. H The Bland–Altman plot showing the correlation between the SCR peaks analyzed from the GSR signals collected by the SQC-SAS wearable and commercial GSR sensors. I Real-time RAP signal obtained from the wrist using the PSI patch. J The P, T, D wave and CT of the RAP waveform, demonstrating the ability to accurately capture corresponding signal patterns. K The corresponding sweat cortisol concentrations of different subjects measured by the MSB patch in the morning and evening, following the circadian rhythm of cortisol (n = 3 technical replicates). Data are presented as mean values ± SD. L The corresponding sweat cortisol concentrations of different subjects measured by the MSB patch before and after Stroop test, shown an increase in cortisol after stress induction (n = 3 technical replicates). Data are presented as mean values ± SD. M The comparison between the RAP signals collected by the SQC-SAS wearable and commercial PPG sensor. N The Bland–Altman plot showing the correlation between the peak amplitude analyzed from the RAP signals collected by the SQC-SAS wearable and commercial PPG sensors. O The comparison between the on-body cortisol concentrations collected by the SQC-SAS wearable and commercial Cortisol ELISA kit. P The Bland–Altman plot showing the correlation between the cortisol concentrations analyzed from the SQC-SAS wearable and commercial Cortisol ELISA kit. Image representatives of live/dead fluorescent micrographs of normal human dermal fibroblast cells cultured at 1, 3, and 7 days in direct contact with Q Carbagel of the MSB patch and R Au/PI electrode of the PSI patch (Scale bar: 50 µm). Biocompatibility comparison between Carbagel and Pilogel: S viability quantification of normal human dermal fibroblast cells assessed by calcein-AM/EthD-1 on days 1, 3, and 7 of culture and T Metabolic activity assay on days 1, 3, and 7 of culture of normal human dermal fibroblast cells (n = 3 technical replicates). Data are presented as mean values ± SD. Biocompatibility of the Au/PI electrode: U viability quantification of fibroblast cells assessed by calcein-AM/EthD-1 on days 1, 3, and 7 of culture and V Metabolic activity assay on days 1, 3, and 7 of culture of fibroblast cells (n = 3 technical replicates). Data are presented as mean values ± SD. Long-term stability of the SQC-SAS for 14 days demonstrating reusability of the sensors and the capability of prolonged sensing W ECG, X GSR, Y RAP signals and Z tracking daily cortisol concentrations for 2 weeks.
The MSB patch, integrated with the IP and microfluidic systems, was used to track cortisol level fluctuations in human sweat at 10 a.m. and 5 p.m., chosen to capture the typical peak in the morning and decline in cortisol levels throughout the day. Sweat induction, cortisol measurement, and sensor restoration followed the optimized procedures outlined above. Figure 4K shows the cortisol concentrations for different subjects, recorded in the morning and afternoon on the same day. The cortisol concentration showed a decrease from morning to night, consistent with the natural circadian reduction in cortisol levels60. Supplementary Movie 10 demonstrates wireless IP, simultaneous PSI, and MSB signal collection, and the restoration process of the reusable MSB patch for continuous stress monitoring on the human wrist using the SQC-SAS wearable, delivering stable results across two consecutive measurements. To demonstrate the sensor’s reusability and stress monitoring capability, we utilized the MSB patch to measure sweat cortisol levels before and after administering the Stroop test, which serves as a stress inducer. Figure 4L displays the sweat cortisol concentrations for different subjects, recorded before and after the Stroop test. The data indicate an increase in cortisol levels following the stress event, aligning with the typical endocrine system response to stress61. These findings highlight the MSB patch’s effectiveness in accurate, on-demand monitoring of sweat cortisol and stress detection.
The SQC-SAS wearable’s M&M panel was further evaluated by comparing it with commercial gold-standard systems. PSI and MSB signals were captured simultaneously from the same subject using both the M&M panel and the commercial devices, facilitating a direct comparison of performance. To ensure the accuracy and reliability of the physiological signals captured by the M&M panel, two evaluation processes were devised, using the commercial systems as a reference. First, the R-squared (R²) score was established as the metric for evaluation. This metric acts as a dependable indicator to identify any morphological variations between the signals captured by the panel and those captured by commercial systems. Figure 4E, G, M illustrates example samples of ECG, GSR, RAP, and cortisol signals recorded by the commercial systems and the M&M panel simultaneously. The initial visualization demonstrates that the M&M panel can capture physiological signals with quality comparable to commercial systems. Computed R² score values of 0.98, 0.99, and 0.98 for ECG, GSR, and RAP indicate that the M&M panel successfully captures the morphological characteristics of all physiological signals. The MSB patch was further compared with commercial gold-standard systems, like enzyme-linked immunosorbent assay (ELISA) for cortisol detection. Figure 4O displays the cortisol concentration of four human sweat samples measured by two systems. The regression analysis reveals an R² value of 0.99, indicating a high level of correlation between the results from our device and the gold-standard measurement method. Second, the integrity of each signal was evaluated by extracting the most crucial feature from each signal captured with the M&M panel and comparing them with the same feature from signals recorded simultaneously by commercial systems. This comparison was conducted using the Bland-Altman plot62,63,64,65,66,67, which assesses the agreement between two different measurement techniques by plotting the difference between the measurements against their mean, evaluating the relationship between the extracted features from signals recorded by the M&M panel and those recorded by commercial systems. Figure 4F, H, N, P showcases the Bland-Altman plots for all physiological signals. According to these plots, the mean error difference between the features extracted from the M&M panel and the commercial signals are 0.71429 for heart rate (HR) derived from ECG, 0.88571 for GSR phasic peaks count, −0.03044 for RAP systolic peaks amplitude, and 0.00146 for the cortisol concentration. These values indicate that the average difference between the features extracted from the M&M panel and commercial signals is quite minimal. The results demonstrate that the sensors on the SQC-SAS exhibit reliable performance comparable to commercial products.
To further validate the biocompatibility of the M&M panel, we conducted a series of evaluations focusing on the Au/PI electrode and IP gel, materials that are in direct contact with the skin. Other components of the panel utilized commercially available medical tape. The viability of normal human dermal fibroblast cells grown on these materials was assessed using calcein-AM/EthD-1 staining at days 1, 3, and 7 of culture (Fig. 4Q, R, S, U). Additionally, the metabolic activity of the normal human dermal fibroblast cells was analyzed to provide a comprehensive view of cellular health and compatibility (Fig. 4T, V). We further compared the biocompatibility of our IP gel (Carbagel), which incorporates carbachol, with the commercially available Pilogel. Details of this comparison are discussed in Supplementary Note 4 and illustrated in Supplementary Fig. 1. These assessments ensure that all materials directly interacting with the skin are safe and non-toxic, further substantiating the panel’s suitability for prolonged contact during wearable applications. To demonstrate the long-term stability, reusability and reliability of the SQC-SAS system, we conducted continuous physiological monitoring across 14 days. The physiological signals ECG, GSR, and RAP were consistently recorded from day 1 through day 14, showing minimal degradation in signal quality (Fig. 4W, X, Y). Daily sweat cortisol levels were tracked from 8:00 to 20:00 h, maintaining stable readouts over the same period and the results further validate the daily cortisol circadian rhythm (Fig. 4Z). These results underscore the system’s stability, reusability and its ability to support prolonged sensing.
Comprehensive evaluation and performance of the SQC-SAS wearable for continuous stress monitoring
The SQC-SAS wearable integrates both PSI and MSB sensing functionalities, enabling continuous multimodal signal recording (Fig. 5A). The MSB sensor is designed for cortisol monitoring, with its layered construction effectively separating sweat sampling areas from the IP gels to ensure accurate sweat collection and analysis. This design enables precise control of sweat flow and maintains sample integrity, as illustrated in Supplementary Fig. 13. Concurrently, the PSI patch incorporates essential sensors for monitoring PSIs. The PSI patch’s ultra-thin electrodes, laminated onto Tegaderm film and fabricated using the CPTP method (Supplementary Figs. 14, 15 and Supplementary Note 6), exhibit excellent mechanical durability and flexibility. This design enables the electrodes to conform seamlessly to non-flat surfaces, such as the human wrist, without damage, ensuring reliable performance even under dynamic conditions. To facilitate on-body continuous and long-term monitoring, the M&M panel is integrated with the SQC-SAS wearable’s BLOSDA. This integration enables wireless data collection and IP for on-demand sweat sampling, powered and controlled by the WLR or smartphone through NFC (Fig. 5B and Supplementary Note 7). The flexible BLOSDA integrates an NFC transponder (tag) that harvests electromagnetic energy from the NFC reader through a flexible antenna. The system includes MCU and distinct AFE circuits, which transduce raw signals from the M&M panel into digitized form for wireless data transmission. Additionally, the BLOSDA features an integrated IP current source, enabling NFC-powered IP for on-demand sweat stimulation. The wireless power harvesting capability eliminates the need for a battery, thus offering BLOSDA enhanced wearability and flexibility. This design achieves virtually infinite battery lifetime, enabling indefinite operation as long as WLR or smartphone remains nearby. The app developed for smartphones can configure SQC-SAS wearable and virtualize multi-sensor data in real-time. (Fig. 5C, Supplementary Movies 5 and 7). The WLR’s primary functions include wireless power transmission to BLOSDA and continuous data reading, facilitated by an MCU, NFC reader, and flexible antenna, all enclosed in a 3D-printed case. Collected data is stored on a microSD card for further processing, enabling continuous data collection during daily activities and supporting days of measurements without data loss. (Fig. 5E, F, Supplementary Movies 6 and 8). The NFC antenna and WLR were designed and characterized for optimum performance at NFC working frequency of 13.56 MHz (Supplementary Note 8). To mitigate potential antenna detuning caused by changes in the operating environment, the BLOSDA antenna was characterized while attached to the wrist using double-sided medical tape while the WLR antenna was positioned inside a 3D-printed case containing the assembled PCBs, battery, and a ferrite sheet. The Smith charts in Fig. 5D show the corresponding equivalent impedances of the WLR and BLOSDA antennas measured at 13.56 MHz. The impedance characteristics of the BLOSDA NFC tag, tuning capacitor, and antenna demonstrate resonance at 13.56 MHz (Fig. 5G and Supplementary Fig. 19A). The performance of the WLR NFC front-end was assessed by measuring the antenna return loss (S11) where the minimum S11 was −28.56 dB at 13.56 MHz, indicating maximum power transmission at 13.56 MHz (Fig. 5G and Supplementary Fig. 19B). The mechanical stability of the antenna was evaluated by bending the antenna up to 30% to mimic wrist curvature while measuring the return loss (Fig. 5H). To demonstrate the wireless power delivery capabilities of our system, we evaluated the voltage harvested by the BLOSDA NFC tag over various distances between the tag and the reader (either a smartphone or WLR) in Fig. 5I. Furthermore, to confirm the integrity of wireless data communication, we compared the ECG data transmitted by the BLOSDA and received by the WLR in Fig. 5J. This comparison showed no noticable data loss or bit errors, thereby validating the system’s reliability for accurate and efficient data transmission. The integration of NFC technology makes the device highly suitable for real-time, and continuous monitoring.

A Illustration of wireless data collection using the SQC-SAS wearable. B The function block diagram of the SQC-SAS wearable C Developed app user interface for the smartphone to communicate with the SQC-SAS wearable. D (i) WLR and (ii) BLOSDA antenna equivalent inductance, resistance, and Q factor measured at 13.56 MHz. The WLR antenna was characterized in the presence of ferrite sheet and PCB components. The BLOSDA antenna was characterized while attached to the human wrist. E Optical image of the SQC-SAS wearable wearing on the wrist with the WLR (Scale bar: 2 cm). F Structure illustration of the WLR. G Measured impedance characteristics of the tuned BLOSDA NFC tag showing resonance at 13.56 MHz. Return loss of the WLR NFC front-end showing the reader delivers maximum power to the antenna at 13.56 MHz. H Return loss of the WLR NFC front-end when the antenna is under mechanical bending up to 30%. I Voltage harvested by the BLOSDA NFC tag at various distances between the tag and the reader (either a smartphone or WLR), demonstrating adequate wireless power delivery across the tested range. J Comparison of ECG data transmitted by the BLOSDA and received by the WLR, confirming the integrity of wireless data communication with no data loss or bit errors detected. Continuous and multimodal monitoring of a subject’s stress response and the extracted features (Cortisol level, RAP, RAP WPS, CT, ECG, ECG WPS, HR, SCR, SCL, and ST) under three different stressors: K CPT; L intense exercise; and M quiz.
To demonstrate the capabilities of the SQC-SAS wearable in monitoring multimodal signals, controlled experiments were conducted using well-known stressors. The recorded PSI and MSB signals, along with their wavelet power spectrums (WPS) as well as their extracted features, including crest time (CT) from RAP, HR from ECG, and skin conductance level (SCL) and skin conductance responses (SCR) from GSR, are presented in Fig. 5K–M and Supplementary Movie 11. In each experiment, on-body biomolecular and physiological data exhibited significant variations in response to different stressors. These findings emphasize the body’s unique reactions to various stress conditions and showcase the SQC-SAS wearable’s ability to accurately detect and analyze these changes. During the CPT (Cold Pressor Test) test, cortisol levels increased from a baseline of 86 nM to 104 nM, then gradually decreased to 97 nM by the end of the test. However, cortisol levels demonstrated a larger change during the math quiz challenge, rising from 86 nM to a peak of 113 nM. HR also varied with the type of stressor, increasing from an average of 89–107 bpm during the quiz, and from an average of 87–95 bpm during exercise. Skin conductance also responded differently across stressors, and ST, although stable during the quiz, showed a slight increase during exercise and a significant decrease during CPT. These results highlight the SQC-SAS wearable’s capability to capture physiological variations, enabling continuous monitoring of different types of stress.
On-body assessments were conducted on human subjects to demonstrate the capability of the SQC-SAS wearable for continuous stress monitoring for 24 h. During this study, the subject, wearing the device on the forearm with the WLR positioned for continuous signal recording, engaged in a range of activities including meetings, meditation, eating, running, movie-watching, resting, and sleeping, while both PSIs and MSB levels were monitored. The participant noted the tasks performed throughout the day along with their start and end times, which were then used to annotate the corresponding task periods. For each cortisol level measurement, an MSB restoration process was employed to prepare the sensor for the next reading. This process effectively flushed out the old sweat sample and replaced it with a new one, ensuring that each reading was accurate and reliable. As the results shown in Fig. 6A, in the morning, cortisol levels (MSB signal) peaked at 105 nM, consistent with circadian rhythms, and fell to 79 nM after waking up. However, a check-in meeting elevated cortisol to 95 nM, reflecting cognitive stress, with corresponding increases in HR, frequency of SCR peaks, and SCL. Meditation subsequently reduced cortisol levels smoothly, with also a decrease in HR, SCR peaks amplitude, SCL, and ST, while CT increased. As the subject engaged in physical activities like heavy running, cortisol levels showed a slight increase, rising from 84 to 94 nM, an expected response to physical exertion as the body adapts to increased demands. Exercise also elevated HR from an average of 84–96 bpm, while simultaneously increasing SCR peak incidence, SCL, and ST, with a concurrent decrease in CT. Watching a horror movie significantly elevated cortisol levels to 107 nM, along with increased vascular activity and skin conductivity. In contrast, stable vital signs and cortisol levels were observed during resting. While vital signs remained mostly stable during sleep, a slight decrease in vascular activity and body temperature was evident, with cortisol levels rising gradually in alignment with the body’s circadian rhythm (Supplementary Fig. 20). To demonstrate the prolonged capability, we conducted 72 h stress monitoring using the SQC-SAS device, as shown in Supplementary Fig. 21. This extended assessment confirmed the system’s operational stability and accuracy in tracking both physiological and biochemical stress markers, thereby demonstrating its robustness for stress profiling.

A Wireless and continuous multimodal stress monitoring during various activities. The continuous and multimodal monitoring of a subject’s stress response during activities and the extracted features from the data collected by the SQC-SAS wearable (Cortisol level, RAP, RAP WPS, CT, ECG, ECG WPS, HR, SCR, SCL, and ST). B Inception-MABFDNN model structure integrating ECG, GSR, RAP, ST, and cortisol signals for stress detection. C Representative confusion matrix for subject-independent evaluation in distinguishing stress from non-stress states (labeled as Rest states) and D in distinguishing subclasses of stress, including cognitive stress, emotional stress, physical, psychosocial, and environmental stress.
Stress detection using machine learning
The subjective interpretation of physiological signals for stress diagnosis is prone to biases, is time-intensive, and demands expertise from clinicians. In recent years, many researchers have turned their attention to ML and deep neural network (DNN) algorithms. While extracting stress-related features from multiple physiological signals and utilizing them in traditional DNN ML models is a widely adopted approach in stress detection studies33, deep learning methods offer a fundamental advantage by simultaneously and automatically learning hierarchical representations directly from raw signals. This approach eliminates reliance on predefined features, enabling the model to adaptively extract both local and global patterns across different signal modalities with minimal domain-specific preprocessing. To exploit these advantages, the Inception Multimodal Attention-Based Fusion Deep Neural Network (Inception-MABFDNN) was developed for multimodal feature extraction and stress classification. The architecture integrates a 1D-Inception module (Supplementary Note 10 and Supplementary Fig. 23A), optimized for physiological signal processing. Unlike standard one-dimensional convolutional neural networks (1D-CNN) layers (Supplementary Fig. 23B), which use a fixed kernel size with either max or average pooling, the 1D-Inception module processes inputs in parallel using multiple convolutional kernels (1 × 1, 1 × 3, and 1 × 5) alongside a parallel max pooling path. This structure captures multi-scale dependencies by analyzing signals at multiple resolutions68. Considering that different patterns extracted from ECG, GSR, RAP, and ST have different effects on predicting stress and its subclasses, we utilized the soft attention (SA) mechanism69 (Supplementary Note 11) to weigh and fuse all the extracted patterns from all modalities, thus enabling the model to prioritize the most critical patterns for effective stress detection. The Inception-MABFDNN structure is designed to adeptly extract patterns and utilize information from five different signals: ECG, GSR, RAP, ST, and Cortisol (Fig. 6B). This integration of diverse physiological signals into a singular analytical framework contributes to a high detection performance. To ensure a robust evaluation of the model, we employed both subject-independent and subject-dependent approaches. In the subject-independent setting, the model achieved high performance in binary classification of stress versus rest states, with an average accuracy of 93.347% ± 2.103%, and F1-score of 93.323% ± 2.128% (Supplementary Fig. 25A). Under the subject-dependent evaluation, performance increased, yielding an accuracy of 97.027% ± 0.995%, and F1-score of 97.045% ± 0.899% (Supplementary Fig. 26A). For subclassification of stress types, the model attained an accuracy of 90.962% ± 2.815%, and F1-score of 90.878% ± 2.876% in the subject-independent evaluation (Supplementary Fig. 25B). In the subject-dependent case, accuracy was 93.998% ± 2.082%, and F1-score of 93.955% ± 2.107% (Supplementary Fig. 26B). Representative confusion matrices are shown for the subject-independent classification of stress versus rest (not-stress) states (Fig. 6C) and the subclassification of stress types (Fig. 6D), as well as for the subject-dependent classification of stress versus rest states (Supplementary Fig. 27A) and the subclassification of stress types (Supplementary Fig. 27B). Supplementary Note 12 and Supplementary Fig. 28 contain detailed explanations of our complementary analyses of dataset characterization, the interpretability of stress detection using traditional ML, and the validation of the Inception‑MABFDNN design.
A comparative analysis between the developed SQC-SAS device and leading commercial smartwatches is presented in Supplementary Table 3, highlighting critical differences in PSI/MSB sensing capabilities, simultaneous multimodal monitoring, stress detection functionality, and stress subtype analysis. In our study, the performance of the SQC-SAS wearable and commercial smartwatches was systematically evaluated across various conditions, including non-stress states of sitting, standing, and light exercise, and stress states of CPT and math quiz. As illustrated in Fig. 7, commercial smartwatches, which depend solely on a single physiological signal indicator (e.g., PPG), demonstrated limited accuracy and were prone to misclassification errors, including frequent false-positive and false-negative stress detections. Notably, these commercial devices incorrectly identified neutral activities, such as standing or mild exercise, as stress events, exhibiting accuracies ranging only between 0 and 25% under non-stress conditions. In contrast, our proposed SQC-SAS system, integrating multiple PSI signals and MSB, consistently achieved an impressive ≥90% accuracy rate in distinguishing between stress and non-stress states. Furthermore, commercial smartwatches lack the capability for subclassifying stress. Conversely, the multimodal PSI and MSB sensing, together with continuous, long-term, and simultaneous monitoring features of the SQC-SAS wearable, enable it to not only quantitatively define stress but also differentiate among distinct stress subtypes through comprehensive stress profiling, underscoring the advancement of integrated stress analysis in wearable devices. Supplementary Table 4 provides an additional benchmark comparison between existing wearable sweat biosensing systems reported in the current literature and our SQC-SAS wearable. Our work presents a fully integrated wearable platform that uniquely combines simultaneous, continuous, non-invasive, and autonomous MSB and PSI sensing, enabling quantitative and comprehensive stress assessment and subclassification.

Stress level outputs and prediction accuracies from the Commercial Watch 1 and Commercial Watch 2 are compared against those of the proposed SQC-SAS wearable under multiple scenarios (n = 3 technical replicates), including non-stress states (sitting, standing, and light exercise) and stress conditions induced by environmental (CPT) and cognitive (Math quiz) stressors using the subject-independent evaluation approach. Acc. accuracy, FP false positive, FN false negative.