I spent this weekend writing a single CUDA megakernel of about 1,200 lines that runs an entire Qwen3-0.6B forward pass in one persistent GPU launch. It decodes, under very specific conditions, at 1,000 tokens/second on an RTX 5090 in bfloat16 (no quantization), limited mostly by memory bandwidth now.
This kernel descends from Elliot Arledge’s MegaQwen, which achieved 530 tok/s on an RTX 3090, but only ~490 tok/s on a 5090. I had to spend a full day tuning the launch parameters and other minor optimizations to push it to around ~717 tok/s. This post will go through the full kernel architecture and every trick used in the stack for educational purposes. You can find the source code here.
Part 1
Single-token decode in a 0.6B model is entirely memory-bound. Every step reads roughly 1.19 GB of weight data (800 MB across 28 layers + 311 MB for the LM head) and does rather trivial arithmetic on it. The RTX 5090’s GDDR7 can deliver 1,674 GB/s of read bandwidth (93% of the 1,792 GB/s theoretical peak). At that rate, the absolute minimum step time is:
1,192 MB / 1,674 GB/s = 712 us = 1,404 tok/s
Our kernel achieves roughly 1,000 us per step, which means we spend 712 us reading weights and 288 us on everything else, which includes synchronization, instruction overhead, and the autoregressive token readback. The entire optimization story is about shrinking that 288 us.
Part 2
Everything runs inside ldg_decode_kernel_persistent: 128 thread blocks, 512 threads each, launched as a regular (non-cooperative) kernel. I did test higher thread block counts and so on, but after a lot of sweeps, 128 seems to be indeed the sweet spot for 0.6B shapes. The blocks stay resident for the entire forward pass and synchronize using custom atomic barriers. After the megakernel finishes, two small kernels compute the LM head argmax.
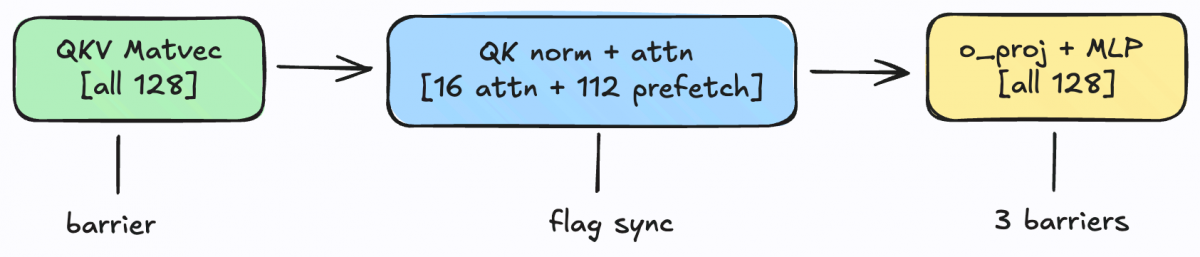
Each of the 28 layers proceeds through six phases:
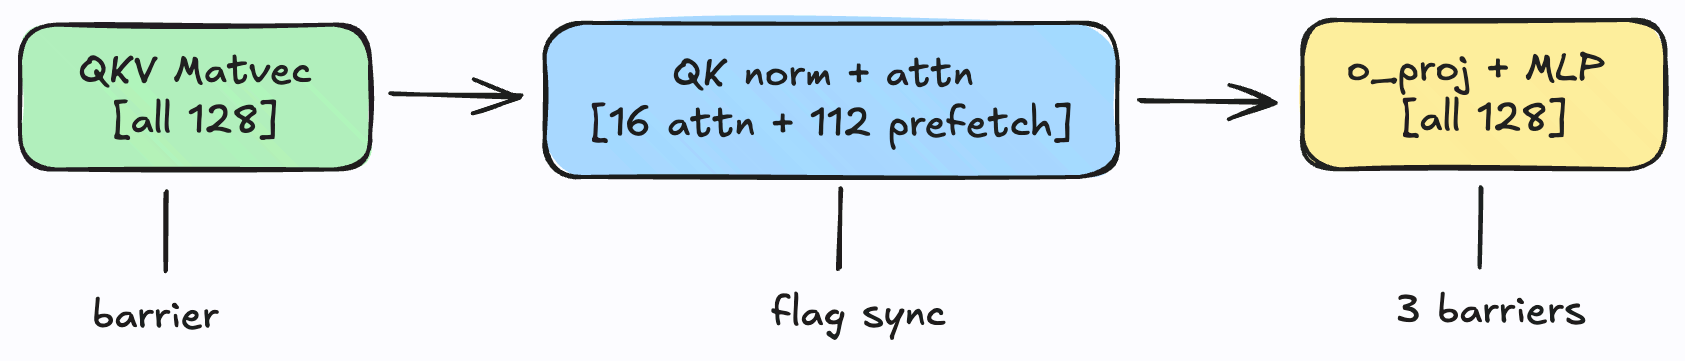
Four phases use a full 128-block atomic barrier. Two phase (QK norm -> attention and attention -> o_proj) use lightweight flag-based syncs that involve only the 16 blocks doing attention work. The other 112 blocks use their free time very productively.
The initial port of MegaQwen to the RTX 5090 ran at roughly ~494 tok/s. The original MegaQwen devlog tells the story of it own optimization journey (170 -> 530 tok/s on RTX 3090), with its key insight being that cooperative megakernels are synchronization-bound for the most part. The 3090 apparently used only 5% of available memory bandwidth, with 140+ grid.sync() calls per step eating most of the wall time.
The 5090 port inherited MegaQwen’s architecture – cooperative grid, block divergence during attention, L2 prefetch – but needed a lot of tuning for the new hardware. For one, it’s 3 generations new, has over double the number of SMs (from 82 to 170) and an L2 cache that is 16 times larger, at 96 MB. The memory module is also GDDR7 now. The techniques below roughly doubled throughput from 494 to 813 tok/s. None are novel individually, but stacking them correctly makes a huge difference in bandwidth utilization.
Redundant RMSNorm
The two layernorms per transform blocks (input norm and post-attn norm) are not very ideal. One block computes the norm factor, then ALL blocks need it. The naive approach would be to put a barrier between “compute norm” and “use norm”. Instead, we should have all 128 blocks compute the norm independently. Each would read the full 1,024-element vector from global memory (4 KB, trivially served from L2), does its own warp-reduction for sum-of-squares, computes rsqrt, and applies the weight. This costs 128x redundant compute (~1,024 FMAs per block, which is nothing) but eliminates an entire barrier per norm.
L1-bypassing 128-bit weight loads
Weight matrices are read exactly once per step and never reused. Caching them in L1 (100 KB per SM on sm_120) wastes capacity that’s better used for activations. All weight loads use inline PTX with the L1::no_allocate hint:
asm volatile("ld.global.L1::no_allocate.v4.b32 {%0,%1,%2,%3}, [%4];"
             : "=r"(out.x), "=r"(out.y), "=r"(out.z), "=r"(out.w)
             : "l"(ptr));
Each load fetches 6 bytes (8x bfloat16 values). With 32 threads per warp each issuing one load like this, the warp generates a coalesced 512-byte transaction, which ends up being exactly 4 cache lines.
Online softmax with vec4 KV access
The attention computation uses online softmax – a single pass over the KV cache that maintains a running max and exponential sum, which rescales prior accumulations when a new maximum is found. The benefit of doing this is that we avoid materializing the full attn matrix. Each of the 16 Q heads is assigned to one thread block, and within a block, the 16 warps process KV cache positions in a strided pattern. The Q-K dot product uses vec4 loads, where each lane holds 4 of the 128 Q dimensions in registers and loads the corresponding 4 K values with a single uint2 load, which ends up covering the full 128 dimensions across the 32-lane warp.
The fast_exp (borrowed from FlashInfer) used in softmax compiles to a single PTX instruction:
__device__ float fast_exp(float x) {
  return ptx_exp2(x * 1.4427f); // exp(x) = 2^(x * log2(e))
}
ptx_exp2 compiles to the ex2.approx.ftz.f32 instruction, which seems to be roughly ~10x faster than just using expf.
RoPE via warp shuffles
Rotary position embeddings pair elements i with element i+64. Since all 128 head dimensions live across a single warp’s registers (32 lanes x 4 registers each), these pairs typically span different lanes. __shfl_sync fetches the partner value in a single cycle, which keeps the entire RoPE computation in registers with zero shared memory traffic.
Two-phase LM head argmax
The vocab projection (151,936 rows x 1024 columns = 311 MB) uses a different parallelization than the megakernel. 1,184 blocks of 256 threads, and with each warp processing 2 vocab rows simultaneously, which amortizes the hidden-state load. Each block emits it local (max_logit, max_index) pair. A single 256-thread block then does a tree reduction over the 1,184 partial results. The LM head achieves roughly ~1,500 GB/s bandwidth (90% of achievable).
Part 3
At 813 tok/s, the kernel was spending 58% of its time reading weights and 42% waiting at barriers. Every per-layer grid.sync() costs ~3 us, and with 6 barriers across 28 layers, that’s ~500 us of pure synchronization overhead per step.
Persistent kernel with atomic barriers
The cooperative kernel used cudaLaunchCooperativeKernel with cg::grid_group::sync(). The cooperative launch mechanism imposes constraints on block count and carriers per-barrier overhead. I ended up replacing it with a regular kernel launch and a custom barrier:
struct AtomicGridSync {
  unsigned int* counter;
  unsigned int* generation; // monotonically increasing
  unsigned int nblocks;
  unsigned int local_gen; // per-block tracking (prevents ABA race)

  __device__ void sync() {
    __syncthreads();
    if (threadIdx.x == 0) {
      unsigned int my_gen = local_gen;
      asm volatile("fence.acq_rel.gpu;" ::: "memory");
      unsigned int arrived = atomicAdd(counter, 1);
      if (arrived == nblocks - 1) {
        // Last block: reset counter and advance generation
        *counter = 0;
        asm volatile("fence.acq_rel.gpu;" ::: "memory");
        atomicAdd(generation, 1);
      } else {
        // Spin on generation counter
        volatile unsigned int* vgen = (volatile unsigned int*)generation;
        while (*vgen  my_gen) {}
      }
      local_gen = my_gen + 1;
    }
    __syncthreads();
  }
};
The most important design choice here is there monotonic generation counter with per-block local tracking. A naive sense-reversing barrier has an ABA race, where if a fast block finishes one barrier and enters the next before a slow block exits the current one, the slow block can misinterpret the fast block’s new arrival as the old barrier completing. The fix I arrived at was have each block track its own local_gen, which it increments after each barrier. The wait condition is *generation > my_local_gen, not *generation != last_read. Since local_gen is per-block and monotonic, a generation bump from barrier N can never satisfy barrier N+1’s wait condition (which requires generation > N+1). I use fence.acq_rel.gpu rather than __threadfence(), as you can see in the code snippet above. Both provide device-scope memory ordering, but the fence instruction seems to be lighter on Blackwell, where it establishes ordering constraints without necessarily flushing the entire L1.
The barrier state is reset on-device at kernel startup (block 0 writes zeros, all blocks sync via a bootstrap barrier), which avoids per-step cudaMemsetAsync host calls. Position and token ID are written to device memory via cudaMemcpyAsync from pinned host buffers, making the kernel args immutable and the launch CUDA-graph-compatible.
Flag-based partial barrier elimination
Of the six per-layer barriers, two exist solely because of the 16 attention blocks. The other 112 blocks are idle during attention. Replacing these two barriers with lightweight atomic flags saves ~2 us per barrier x 28 layers = ~56 us:
KV cache readiness (barrier #2): block 0 writes KV cache entries during QK norm, then signals with atomicExch(kv_flag, layer + 1). Blocks 1-15 spin on the flag before starting attention. Blocks 16-127 skip entirely since they don’t do attention.
Attention completion (barrier #3): each attention block increments attn_flag after finishing. All 128 blocks wait for it to reach 16 * (layer + 1) before 0 projection.
These flags are completely independent of AtomicGridSync. They use monotonic counters (layer 0 sets to 1, layer 1 to 2, etc.) and need only a per-step reset. The remaining four barriers use AtomicGridSync normally, and all 128 blocks call it exactly four times per layer.
Productive spin
This was the breakthrough, actually. The last two optimizations helped the kernel to go from ~813 tok/s to 890, then to 905, but this one took it to 1,000 tok/s. After the flag-based sync, blocks 16-127 sit in a useless busy-spin on attn_flag while 16 blocks compute attention. The attention phase touches almost no memory bandwidth (just ~400 KB of KV cache at typical sequence positions), which leaves the memory subsystem almost entirely idle.
I replaced the empty spin with prefetch.global.L2 instructions that warm the entire next phase’s weight set:
if (block_id >= ATTN_BLOCKS && threadIdx.x != 0) {
  // 112 blocks x 511 threads = 57,232 threads issuing prefetch
  int all_total = o_total + gate_total + up_total + down_total;  // ~23MB
  for (int i = start + (threadIdx.x - 1); i  end; i += LDG_BLOCK_SIZE - 1) {
    const __nv_bfloat16* ptr = /* dispatch to O/gate/up/down */;
    asm volatile("prefetch.global.L2 [%0];" :: "l"(ptr));
  }
}
Thread 0 of each block still spins on attn_flag. Threads 1-511 issue prefetch instructions that bring 0 projection, gate, up, and down projection weights (~23 MB total) into L2 cache. When the attention blocks finish and all blocks proceed to 0 projection, the weights are already resident in L2 instead of requiring DRAM fetches. This seems to work because there’s no bandwidth contention, the L2 cache has plenty of room, and the timing is somewhat perfect. The 16 attention blocks read tiny KV cache data from one memory region. The 112 prefetch blocks target weight matrices in a completely different region, and the memory controller serves both concurrently without interference. Our GPU has a whole 96 B of L2, so it can hold 23 MB of weights plus 30 MB of KV cache with space to spare. Not to mention, the prefetch completes during attention. o_proj starts immediately after the attn_flag wait, so it manages to find warm L2 instead of cold DRAM. The latency of the entire O+MLP weight loading is entirely hidden behind the attention computation.
I did try to have idle warps inside o_proj and down proj blocks prefetch while active warps were computing. That unfortunately seemed to have hurt performance by about 8.7%. During those phases, the active warps are already saturating memory bandwidth with weight loads, so the prefetch competes. During attention, the bandwidth is 95% idle. I guess you should always prefetch into free bandwidth, and not into contended bandwidth.
Part 4
A minor but free optimization: the first layer reads the embedding directly from the embedding table via __ldg instead of writing it to hidden_buffer and then reading it back. Since every block reads the same 2 KB row (1,024 bf16 values) and __ldg goes through L2, this is trivially fast and eliminates one full barrier at kernel startup.
Part 5
I’ll quickly go through some things that I tried but didn’t work.
More blocks (128->170) to use all SMs resulted in a -2% perf loss because it would need even more atomics per barrier. 256-bit vector loads (uint8) doesn’t work on sm_120 because it caps vector loads at 128-bits. Bulk L2 prefetch (cp.async.bulk.prefetch) had a much higher latency than __ldg fallback (about -5%). 2-warp cooperation for underutilized phases had a similar latency issue, since it adds __syncthreads() per-row overhead. L2 evict-first for weights was even worse at -8% because premature eviction hurts same-layer reuse. I tried CUDA graphs, but honestly it didn’t make a difference. Maybe per-step cudaStreamSynchronize for token readback just dominates. I did play around with --maxregcount tuning, but it didn’t do a thing. I think we’re already at near optimal register allocation here.
Final Part
Here’s the per-layer profile:
Fixed overhead (LM head + startup):   216 us
Per-layer (28 layers x 28.0 us):      784 us
  Theoretical minimum (pure BW):      18.8 us
  Barrier + instruction overhead:     9.2 us
Total:                                1000 us
The 71% bandwidth utilization ceiling comes from the four remaining full-grid atomic barriers per layer (~2.2 us each x 4 = 8.8 us) plus two flag syncs (~0.2 us each) and miscellaneous instruction overhead. Getting past this would need me to either reduce the barrier count even further (which would be hard! the remaining four all need 128 blocks) or making each barrier cheaper (which is limited by fence.acq_rel.gpu latency and atomic round-trip time).
Aside from that, the only way I can think of beating this kernel for this exact workload is to either cheat with quantization, or violate the laws of physics.
Thanks for reading. I will update this if I manage to break past 1,000 tok/s.
Appendix: Profiling data
Per-layer cost decomposition
Measured at low sequence position (0-9) where attention overhead is negligible, using CUDA events:
Phase                                   Weight    BW time    % of layer
------------------------------------------------------------------------
QKV matvec (+ RMSNorm)                 8.39 MB    5.0 us       17.7%
QK norm + RoPE + attention              ~0 MB     ~0 us         0.0%
O projection                           4.19 MB    2.5 us        8.8%
Post-norm + Gate/Up + SiLU            12.58 MB    7.5 us       26.6%
Down projection                        6.29 MB    3.8 us       13.3%
Barriers + overhead (4 full + 2 flag)     --      9.5 us       33.6%
------------------------------------------------------------------------
Total per layer                       31.45 MB   28.3 us      100.0%
One-third of the per-layer time is synchronization overhead. The rest is bounded by GDDR7 read bandwidth at 1,674 GB/s.
Step cost breakdown
Fixed overhead (LM head + startup):     211 us
28 transformer layers (28 x 28.3 us):   793 us
                                        ------
Total:                                  1004 us  =  996 tok/s
Bandwidth utilization across optimization stages
                                  tok/s    Effective BW    % of 1674 GB/s
MegaQwen port (baseline)           494         590 GB/s        35.2%
+ 5090 tuning                      813         969 GB/s        57.9%
+ Persistent atomic barriers       890        1061 GB/s        63.4%
+ Flag-based partial barriers      905        1079 GB/s        64.4%
+ Productive spin                 1000        1192 GB/s        71.2%
Position-dependent throughput (sequence positions 0-200)
Position      Step time    Throughput
   0- 19      1004 us       996 tok/s
  20- 39      1000 us      1000 tok/s
  40- 59       996 us      1004 tok/s
  60- 79       994 us      1006 tok/s
  80- 99       995 us      1005 tok/s
 100-119       998 us      1002 tok/s
 120-139      1003 us       997 tok/s
 140-159      1011 us       990 tok/s
 160-179      1022 us       979 tok/s
 180-199      1030 us       971 tok/s
Throughput stays above 970 tok/s out to position 200. The ~3% degradation comes from attention reading more KV cache entries at longer sequences. Unlike the original MegaQwen (which degraded from 530 to 158 tok/s over the same range on RTX 3090), the 5090’s larger L2 cache (96 MB vs 6 MB) keeps the KV cache resident.
Weight data budget
Component                    Size        % of total
28 layers (31.45 MB each)   880.9 MB        73.9%
LM head (151936 x 1024)     311.2 MB        26.1%
                            --------
Total per step              1192.1 MB       100.0%
Chrome trace (torch.profiler)
A Chrome trace is available for download. Open it in chrome://tracing or Perfetto to see the per-step GPU timeline. Here’s the per-kernel breakdown averaged over 20 decode steps:
Kernel                              Avg time     % of step
ldg_decode_kernel_persistent          795 us        76.7%
ldg_lm_head_phase1                    187 us        18.0%
ldg_lm_head_phase2                      2 us         0.2%
Memcpy HtoD (position + token_id)      29 us         2.8%
Memcpy DtoH (output token)             10 us         1.0%
Other (launch overhead, gaps)          12 us         1.3%
                                    ----------
Total per step                      ~1035 us
Each step consists of 6 operations on the CUDA stream: 2 small HtoD memcpys (position and token ID from pinned host memory to device), the persistent megakernel (all 28 layers), LM head phase 1 (1,184 blocks scanning 151K vocab rows), LM head phase 2 (single-block tree reduction), and 1 DtoH memcpy for the output token. The cudaStreamSynchronize for the DtoH copy is the serialization point that makes CUDA graphs unhelpful for autoregressive decode.