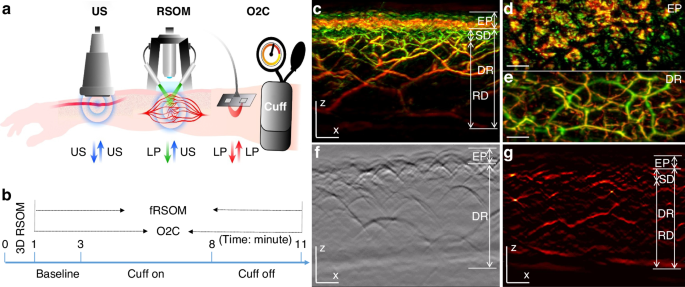
In order to assess cutaneous MiVED, we conducted forearm PORH tests (see Methods, Fig. 1a, b) and examined whether fRSOM could directly visualize the dynamics of the microvasculature at a single capillary level from the surface of forearm skin in humans. Measurements were compared to LDF and WLS measurements (O2C© system) to provide indirect indicators of microvascular perfusion. The PORH procedure (Fig. 1b) included three sets of measurements: 2 min of baseline, 5 min of “cuff on” (inflated cuff at a pressure of at least 40 mmHg above the systolic blood pressure of the subject), and 3 min of “cuff off” (deflated cuff). fRSOM obtained 3D volumetric scans (~4 × 2 × 1.5 mm3, Fig. 1c–e) in 1 min and 2D cross-sectional scans (~4 × 0.1 × 1.5 mm3; Fig. 1g) in 0.5 s that allowed examination of the response to PORH with high spatial or temporal detail. Due to the use of a standard scanner for 3D and 2D images, the position of the cross-sectional images obtained during PORH can be accurately referenced to the corresponding 3D fRSOM images. These two modes are exemplified in Fig. 1c–g. Cross-sectional images, shown as Maximum Intensity Projections (MIPs) of the 3D fRSOM scans, acquired at the forearm skin of a healthy volunteer (Fig. 1c), revealed details of the epidermis and dermis layers at a depth of about 1.5 mm at the illumination wavelength of 532 nm (see Supplementary Fig. S1). MIP images of the 3D volume along different projections depict superficial skin ridges (Fig. 1d), capillary loops and the vascular morphology of the vascular plexus (Fig. 1c, e). Inspection of the raw optoacoustic signals of the 3D fRSOM scan (Fig. 1f) provides a visual assessment of the acquired signal quality. Finally, the reconstructed 2D image of the fRSOM line scan (Fig. 1g) resolves skin epidermis and dermis layer structures that relate well with the 3D MIP image in Fig. 1c. The fRSOM line scan data during an entire PORH test are shown in supplementary Movies 1, 2.

a Schematic illustration of assessment of skin microvascular endothelial function at the forearm by fRSOM and O2C, and macrovascular function assessed by ultrasound (US) during a PORH (post-occlusive reactive hyperemia) test (see Methods); O2C: oxygen to see, a commercial system including laser Doppler flowmetry (LDF) and White-Light Spectroscopy (WLS), simultaneously records blood flow, partial blood volume (rHb) and oxygen saturation (SO2), LP: laser pulse. b The timeline showing 3D-RSOM, fRSOM, and simultaneous LDF and WLS assessments during a post-occlusive reactive hyperemia (PORH) test (2 min baseline, 5 min after inflating the cuff (Cuff on) and 3 min after deflating the cuff (Cuff off)). c Cross-sectional image of the 3D-RSOM scan at the forearm of a healthy volunteer. Corresponding MIP images of the (d) epidermis (EP) and (e) dermis (DR) layers of (c) in the coronal direction. The 3D RSOM images are color-coded to represent the two reconstructed frequency bands (red: larger structures in the bandwidth of 10–40 MHz; green: smaller structures in the bandwidth of 40–120 MHz). The 3D RSOM volume was acquired in a region 4 mm (x-axis) × 2 mm (y-axis), and z is the depth axis. f Raw optoacoustic signals of one fRSOM line scan. The scan region of fRSOM is 4 mm (x-axis) × z (depth axis). g The reconstructed image corresponding to (f). The arrows show the upper subpapillary dermis (SD) layer and the lower reticular dermis (RD) layer—scale bar: 500 µm
To offer a first look ever into the 3D hyperemia response of the skin microvasculature during a PORH test, we obtained ten 3D-RSOM images from the forearm of one healthy volunteer (female, 29 years old) at 1-min intervals (Fig. 2 and Supplementary Fig. S2). Cross-sectional 3D-RSOM images at six-time points and corresponding MIP images of the dermis (DR) vasculature in the coronal plane (Fig. 2a–f) clearly identified significant changes of skin microvasculature across skin depths during hyperemia (see also Supplementary Movies 3, 4 and images in Supplementary Fig. S2). 3D-RSOM images at the baseline (Fig. 2a) resolved rich vasculature in the skin. After initiating the cuff inflation during a PORH test, microvessels in the subpapillary dermis layer (SD, white arrows in Fig. 2b) became less visible (Fig. 2c) and virtually disappeared from the images after 7 min (Fig. 2d and Supplementary Fig. S2), while the melanin layer in the epidermis (EP), serving as a reference, remained constant. Likewise, the vessels in the deeper reticular dermis (RD) layer gradually became invisible (Fig. 2b–d), and the overall image intensity dropped significantly compared to the baseline image (Fig. 2a). After deflating the cuff, a strong hyperemia response was recorded: vascular features were fully recovered, and additional cutaneous vessels appeared (marked by five white arrows on Fig. 2e). The dilation of three vessels during hyperemia (marked by the white arrows labeled 1, 2, and 3 on Fig. 2a) was quantified by measuring the vessel diameter at every minute (Fig. 2g), showing the variability of response patterns of individual capillaries to pressure-induced stimuli depending on their size; larger vessels showed more prominent responses. For example, the mean diameter of vessel 1 was 58 µm at baseline and increased to 69 µm at peak hyperemic response (18% increment of the vessel diameter) after cuff deflation. The mean diameter of vessel 2 was 27 µm at baseline and dilated to 33 µm at peak hyperemia response (22% increment of the vessel diameter) after cuff deflation.

The skin vasculature at the forearm (4 × 2 mm2) of a healthy volunteer was measured by 3D-RSOM at every minute during the 10 min PORH test. a–f Cross-sectional images of 3D-RSOM volumes were acquired at six time points with corresponding MIP images of the dermis layer in the coronal direction below each cross-sectional image. The white arrows in (e) indicate vessels that were visualized for the first time during the reactive hyperemia process. g The diameter changes of three vessels (white arrows 1, 2, and 3 in a) are characterized as the FWHM (full width at half maximum) values during the PORH test. h Changes in the total blood volume in the subpapillary dermis (SD) layer, the reticular dermis (RD) layer, and the whole dermis vasculature (DV) were computed from the 10 RSOM images obtained during the PORH test. i LDF&WLS measurements, including the blood flow, oxygen saturation (SO2), and partial blood volume (rHb) during the PORH test. Scale bar: 500 µm
The average (total) hyperemia process was characterized based on changes observed in the total blood volume computed from 3D-RSOM images (see Methods), as shown in Fig. 2h, where the total blood volume of the subpapillary dermis, reticular dermis, and the whole dermal vasculature (DV including SD and RD layer together) were computed separately. The layer-dependent changes also demonstrated for the first time different responses to the PORH test, indicating that independent layer-specific biomarkers can be extracted from the skin and may contain additional information related to the condition studied. In particular, the response of the subpapillary dermis (SD) appears markedly weaker than the response of the reticular dermis (RD).
Overall, the analyses in Fig. 2 showed the first observations of capillary-specific and layer-specific changes in cutaneous micro-vessels at single-capillary resolution during the reactive hyperemia process. Thus, 3D-RSOM enables quantification of variability and depth-dependent responses not possible by other methods that only resolve bulk and possibly surface-weighted signals, i.e., the output of a single value per method (Fig. 2i).
While the 3D mode of operation yields highly detailed volumetric insights into skin MiVED, each scan takes about one minute to scan a pattern of 4 × 2 mm2 on the skin area. Such temporal resolution is not well suited for detailed capturing of the dynamics of the hyperemia process, as seen in Fig. 2g, h. To overcome this limitation, fRSOM is able to scan faster in a different pattern over a 4 × 0.1 mm2 scan area, such that it can resolve cross-sectional skin images at up to two images per second, allowing capture of MiVED dynamics with up to 2 Hz temporal resolution. In fRSOM’s case, only capillaries on a single slice are captured (Fig. 3), but with finer dynamics (compare Fig. 3m to Fig. 2h). To exemplify the operation of the 2D mode, we show 12 fRSOM skin cross-sectional images (Fig. 3a–l) from a healthy volunteer (male, 34 years old) at different time points during the PORH test. The images resolve finer dynamic microvasculature changes in the subpapillary dermis (SD) and reticular dermis (RD) layers (see Supplementary Movie 5). Figure 3a–d shows skin images at different time points within the two-minute baseline period (Fig. 3a, b) and within the first two min after inflating the cuff (Fig. 3c, d). In complete agreement with the pilot 3D-RSOM measurements presented in Fig. 2, the dermal vasculature gradually disappeared while the intensity of the melanin layer in the epidermis layer, serving as a reference, remained constant. After deflating the cuff, a strong hyperemia response was observed over the first minute (Fig. 3e–j), both in the subpapillary dermis and reticular dermis layers with the appearance of previously unseen vessels as indicated by white arrows in Fig. 3j. Following the hyperemia phase, the microvasculature returns to its baseline appearance (Fig. 3k–i).

12 fRSOM images at different time points during a PORH test are shown in (a–l). The white arrows in (j) indicate capillaries and dermal vessels that were not seen in baseline images and are first visualized upon release of the arterial occlusion. m Normalized vessel density changes in the subpapillary dermis (SD) layer, in the reticular dermis (RD) layer, and the whole dermis vasculature (DV) during the arterial occlusion process. n LDF and WLS measurements, including changes in the blood flow, oxygen saturation (SO2), and partial blood volume (rHb). o Normalized vessel intensity profiles of vessels 1 and 2 (labeled by the white arrows in (a) and the magnified inset). p Time points at peak hyperemia response after deflating the cuff in microvasculature located at various depths in the skin—scale bar: 500 µm
Image intensity profiles of the subpapillary dermis, reticular dermis, and whole dermal vasculature (Fig. 3m) allowed layer-dependent quantification of microvasculature density changes seen in Fig. 3a–l. Similarly to the observations done with the 3D images, different layers were shown to respond differently in the PORH challenge; these changes were captured with approximately 100 times better temporal resolution compared to Fig. 2. In contrast, each of the blood flow, oxygen saturation (SO2), and partial blood volume (rHb) tests resolved only a single surface-weighted value from the skin (Fig. 3n). Comparison of the fRSOM measurements to flow (or SO2) measurements revealed that the change of vessel density, as characterized by fRSOM, was slower than the perfusion changes recorded by LDF, indicating that the particular fRSOM measured vessel density signal discerns a complete restoration of the microvasculature system, contrasting with flow changes that overlook the influences of blood volume effects. Moreover, fRSOM was found to have significantly better inter-day repeatability and reproducibility compared to LDF and WLS (see Methods, Supplementary Figs. S3 and S4).
We further observed that analysis of two different micro-vessels (labeled 1 and 2 in Fig. 3a) showed that capillaries in the subpapillary dermis layer (arrow 1) responded earlier to the cuff occlusion compared to the larger vessels (arrow 2) seated deeper in the reticular dermis layer (Fig. 3o). However, the capillaries recovered in a delayed manner compared to the larger vessels. Figure 3p captures this observation for the entire skin volume sampled, confirming that dermal vessels deeper in the skin reach peak hyperemia ~15 sec faster than superficial vessels.
The dynamics recorded with high temporal resolution in Fig. 3m allowed the extraction of a number of biomarkers. To exemplify this potential and offer a quantitative assessment of endothelial function, we computed three parameters from fRSOM dynamic measurements, i.e., the maximum volume change (MVC), hyperemia ratio (HR), and the time-to-peak (TP) from the intensity profiles of fRSOM, as illustrated in Fig. 3m (see Methods for details). These biomarkers were computed in a layer-specific manner and were applied to assess MiVED in subjects with increased cardiovascular risk. 10 non-smoking volunteers (mean age 30.1 ± 2.3 years) and 10 age-matched smokers (mean age 33.5 ± 3.5 years) were measured during a 10-minute PORH test. LDF&WLS signals were simultaneously recorded for comparison.
Figure 4a–d shows two cross-sectional MIP 3D-RSOM images of the skin at the forearm of a male non-smoker (Fig. 4a) and a male smoker (Fig. 4b), and two corresponding fRSOM images (Fig. 4c, d). The intensity profiles computed from the fRSOM signals during the PORH test for the non-smoker (Fig. 4e) and the smoker (Fig. 4f) showed good temporal agreement with LDF&WLS measurements (Fig. 4g, h). The MVC values (Fig. 4i) of the smoker vs non-smoker groups were 0.34 ± 0.082 (a.u.) and 0.48 ± 0.062 (a.u.) for the entire dermis vasculature (DV) layer, 0.26 ± 0.095 (a.u.) and 0.44 ± 0.054 (a.u.) in the subpapillary dermis (SD) layer and 0.38 ± 0.079 (a.u.) versus 0.49 ± 0.063 (a.u.) in the reticular dermis (RD) layer respectively. Unpaired t-tests and Wilcoxon signed-rank tests indicated significant differences (P = 0.0003 in DV, P P = 0.0015 in RD). We further observed that the MVC value (0.38 ± 0.095) of the subpapillary dermis layer was significantly lower than the MVC value (0.49 ± 0.063) of the reticular dermis layer in the smoker group (P = 0.0068). At the same time, there was no significant difference in the non-smoker group.

Cross-sectional 3D-RSOM images of a male non-smoker (a) and a male smoker volunteer (b). c, d fRSOM images correspond to (a, b), respectively. e, f The image intensity profiles used to characterize endothelial function during the PORH test on a non-smoker and a smoker. g, h Signal profiles of the LDF and WLS measurements done on the same subjects, showing the blood flow, partial blood volume (rHb), and oxygen saturation (SO2) values. i–k Comparisons of the MVC (maximum volume change), HR (hyperemia ratio), and TP (time-to-peak) values in smoker versus non-smoker groups. Values were computed from readings taken in the microvasculature of the subpapillary dermis (SD) layer, the reticular dermis (RD) layer, and the whole dermis vasculature (DV). l, m Measurements of MVC and HR values calculated from the LDF&WLS measurements. n Macrovascular endothelial function assessed by ultrasound flow-mediated dilation during PORH test in non-smokers (V) and smokers (S). o Comparisons of the total blood volume in the dermal layer of non-smokers versus smokers. ns not significant. Scale bar: 500 µm
The hyperemia ratio (HR) values (Fig. 4j) were calculated to serve as a second biomarker with possible relevance to MiVED alterations. In the entire dermis vasculature layer, the smoker group exhibited HR values that were 9.54% ± 4.37%, i.e., significantly lower compared to 20.38 ± 4.43% in the non-smoker group. For smoker versus non-smoker groups, the HR values in the subpapillary dermis layer were 7.67% ± 3.52% versus 19.65 ± 4.84% and 10.52% ± 2.83% versus 20.62% ± 7.94% in the reticular dermis layer respectively. Unpaired t-tests and Wilcoxon signed-rank tests indicated significant differences (P = 0.0002 in DV, P P = 0.0036 in RD). Moreover, the HR values in the subpapillary dermis layer of the smoker group were significantly lower than the values in the reticular dermis layer (P = 0.0454), while there was no statistical difference in the non-smoking group.
The metric, speed of hyperemia response, measured as the time-to-peak (TP) after cuff deflation in Fig. 3m, also exhibited marked differences between the smoker and non-smoker groups (Fig. 4k). When comparing smokers versus non-smokers, the mean TP values were 1.89 ± 0.38 min compared to 1.42 ± 0.40 min in the entire dermis vasculature layer, 1.77 ± 0.38 min versus 1.29 ± 0.40 min in the subpapillary dermis layer, and 2.01 ± 0.41 min versus 1.46 ± 0.37 min in the reticular dermis layer. Unpaired t-tests and Wilcoxon signed-rank tests indicated significant differences (P = 0.0185 in DV, P = 0.0182 in SD, and P = 0.0147 in RD). There were no significant differences in TP values when the subpapillary dermis and reticular dermis layers were compared in the smoker or non-smoker groups.
Similar analysis of the MVC (Fig. 4l) and the hyperemia ratio values (Fig. 4m) derived from the LDF & WLS measurements did not demonstrate statistically significant differences between the smoker and non-smoker groups. A significant change (P = 0.0011) was nevertheless observed in the macrovascular endothelial function assessed by ultrasound during the PORH test when the smoker group was compared to the non-smoker volunteer group (Fig. 4n). Moreover, no marked differences between the smoker and non-smoker volunteer groups were observed in the total blood volume (Fig. 4o) computed from the 3D-RSOM images.
To offer a pilot examination of MiVED biomarkers relevant to cardiovascular disease, we performed targeted measurements in volunteers with CVD and age-matched non-CVD volunteers. Ten volunteers with CVD were measured by fRSOM during a 6-minute PORH test and compared to 10 non-CVD volunteers (HV, see Methods). Figure 5a, b shows two cross-sectional MIP 3D-RSOM images of the skin at the forearm of a non-CVD volunteer (Fig. 5a) and a volunteer with CVD (Fig. 5b). The intensity profiles of a non-CVD healthy volunteer and CVD volunteer are shown in Fig. 5c, d (see Supplementary Fig. S6). The MVC values (Fig. 5e) of the CVD group versus the non-CVD group were 0.16 ± 0.048 versus 0.38 ± 0.068 in the entire dermis vasculature (DV) layer, 0.11 ± 0.024 versus 0.34 ± 0.050 in the subpapillary dermis (SD) layer and 0.21 ± 0.073 versus 0.40 ± 0.048 in the reticular dermis (RD) layer. Unpaired t-tests and Wilcoxon signed-rank tests indicated significant differences (P P P P = 0.0003) compared to the healthy volunteer group (P = 0.0147). The CVD group in comparison to the non-CVD group exhibited significantly lower hyperemia ratio (HR) values (Fig. 5f) of 7.13 ± 3.41% versus 16.38 ± 2.99% in the DV layer, 4.91% ± 3.04% versus 15.13 ± 3.21% in the subpapillary dermis layer, and 9.16% ± 3.45% versus 17.48% ± 3.69% in the reticular dermis layer. Unpaired t-tests and Wilcoxon signed-rank tests indicated significant differences (P P P = 0.0003 in RD). Moreover, the hyperemia ratio values in the subpapillary dermis layer in the CVD group were significantly lower than the values in the reticular dermis layers (P = 0.0115), while there was no statistical difference in the non-CVD group. The mean time-to-peak values (Fig. 5g) of the CVD group compared to the non-CVD group were 2.18 ± 0.20 min versus 1.69 ± 0.27 min in the DV layer, 2.05 ± 0.16 min versus 1.53 ± 0.26 min in the subpapillary dermis layer, and 2.36 ± 0.20 min versus 1.78 ± 0.31 min in the reticular dermis layer. Unpaired t-tests and Wilcoxon signed-rank tests indicated significant differences (P = 0.0011 in DV, P = 0.0182 in SD, and P = 0.002 in RD). The time-to-peak values in the subpapillary dermis layer in the CVD group were significantly lower than the values in the reticular dermis layers (P = 0.0021), while there was no statistical difference in the non-CVD group. Similar to the smoking study, the total blood volume (Fig. 5h) related to the skin microvasculature structure showed no apparent differences between the CVD and the non-CVD groups.

a, b Cross-sectional RSOM images of a healthy volunteer (a) and a CVD volunteer (b). c, d The image intensity profiles were used to characterize endothelial function during the PORH test on a non-CVD healthy volunteer and a CVD volunteer. e–g Comparisons of the MVC (maximum volume change), HR (hyperemia ratio), and TP (time-to-peak) values, computed from the fRSOM image intensity profiles, between the healthy volunteers (HV) and CVD volunteers. Values were calculated from readings taken in the microvasculature of the subpapillary dermis (SD) layer, the reticular dermis (RD) layer, and the whole dermis vasculature (DV). h Comparison of the total blood volume in the dermal layer between the healthy volunteers and CVD volunteers. ns not significant. Scale bar: 500 µm