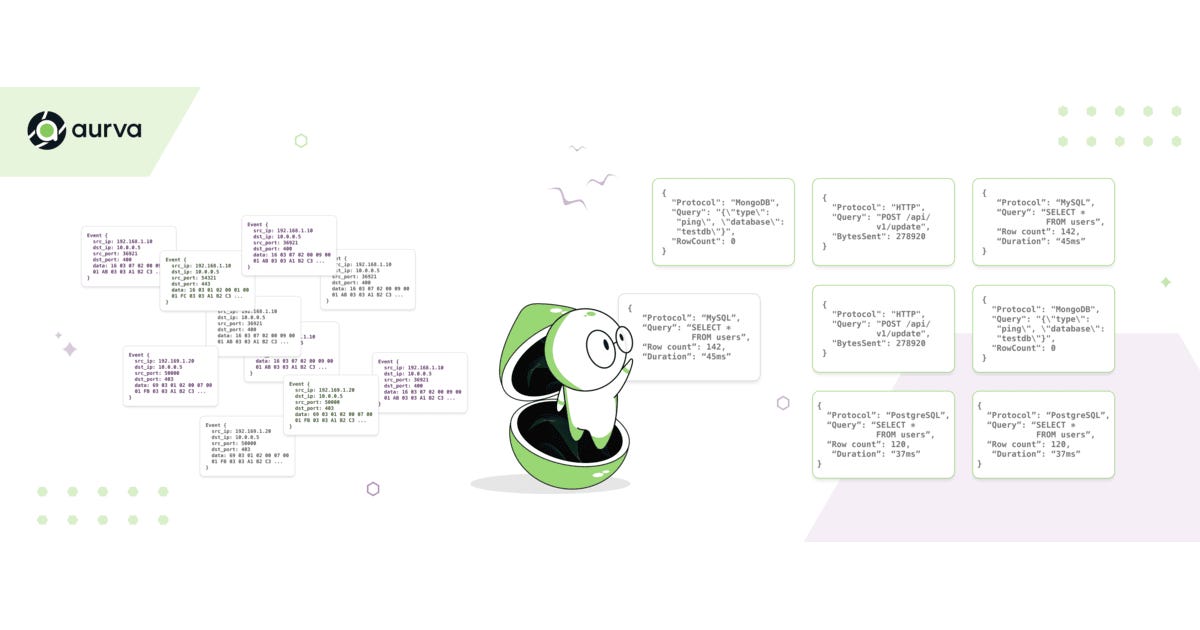
eBPF provides kernel-level visibility into network traffic—capturing packets, monitoring connections, and observing every query and API call in real-time. This makes eBPF a foundational technology for data monitoring and security. However, raw eBPF captures provide only low-level data:
-
Source IP and destination IP
-
Source port and destination port
-
Process name and command line
-
Thread ID (tgid), process ID (pid), file descriptor
-
Raw packet bytes
That’s it. Now what?
You’re sitting on millions of packets per second, each one a 1,500-byte blob of data. You know where it came from and where it’s going, but you don’t know:
-
What protocol is this? Is it MySQL, PostgreSQL, MongoDB, HTTP, or just internal service chatter?
-
Is this a request or a response? Bi-directional traffic needs to be correlated.
-
What’s in the packet? Is it
SELECT * FROM users WHERE email="admin@example.com"or just a heartbeat? -
Who’s actually using this? Is this the payment service or the analytics pipeline?
-
Is there sensitive data here? Are we seeing PII like SSNs, credit cards, or emails?
eBPF is an enabler, not a solution. The hard part starts after you capture the packets.
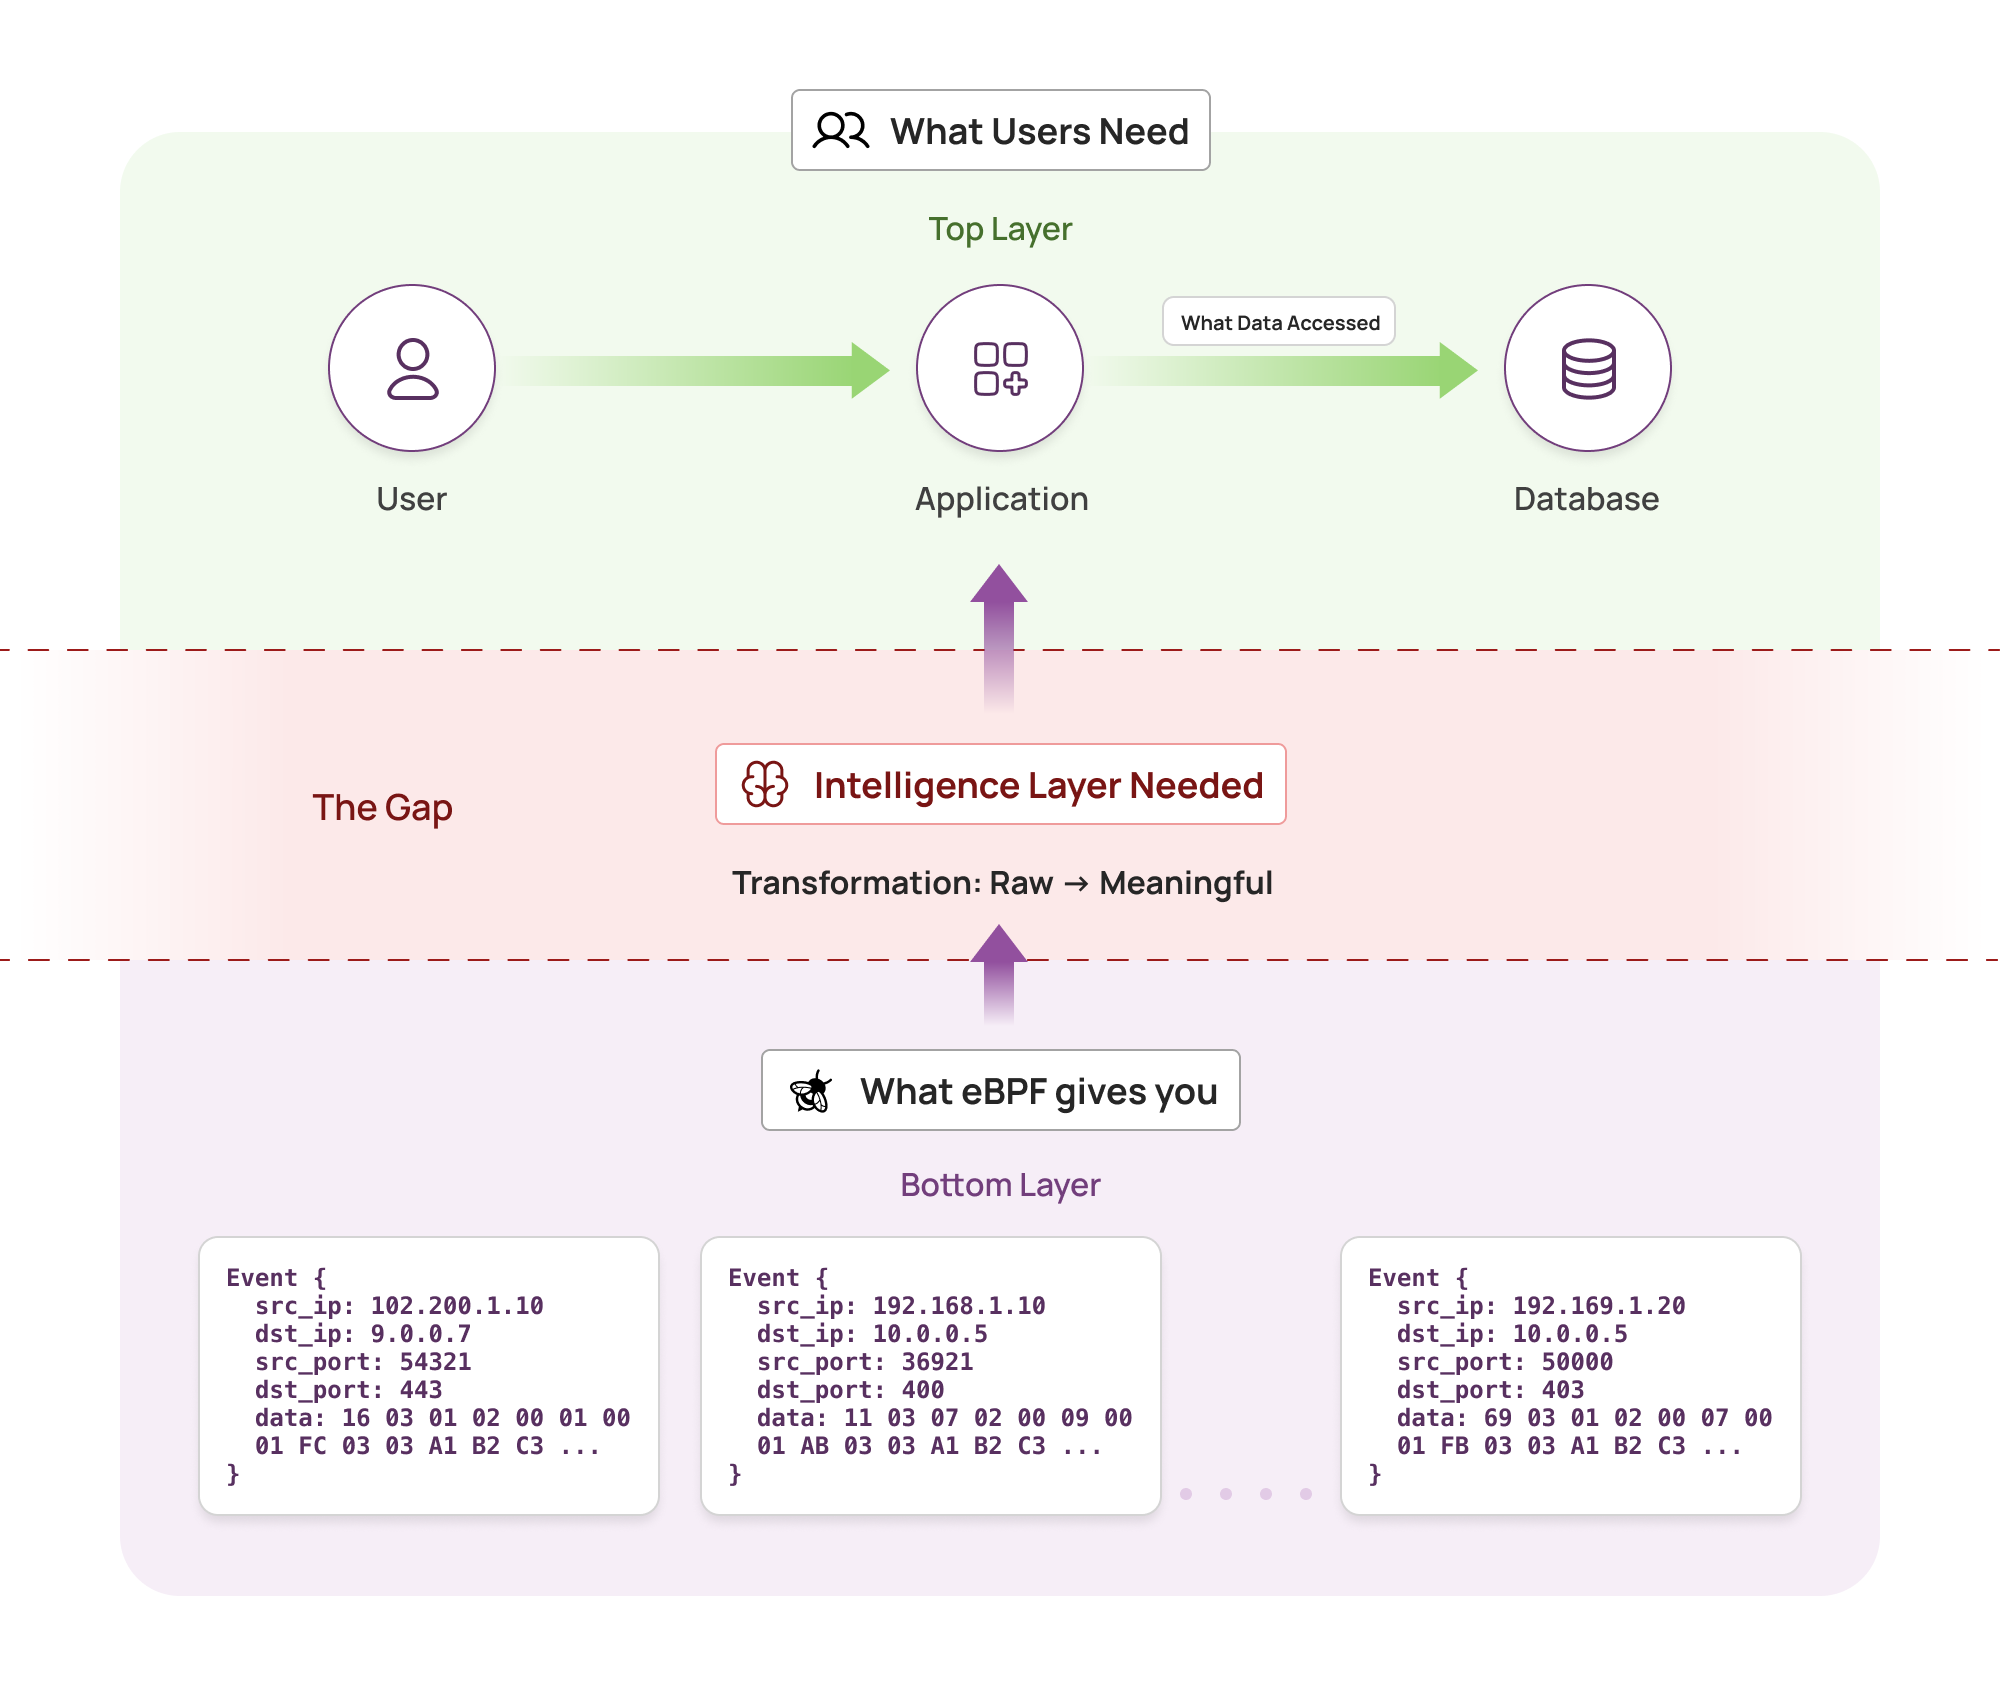
Data security teams need query-level and API-level visibility, not raw packet data. They need answers to questions like:
-
“Did anyone from the analytics team access the production customer database in the last hour?”
-
“Show me all queries that returned email addresses.”
-
“Alert me when production PII is accessed from a non-production environment.”
Bridging the gap between raw eBPF packet captures and these high-level queries requires dedicated protocol intelligence.
We’re processing over 20 billion queries and API calls per day across our customers. At that scale:
-
Millions of packets per second need to be analyzed
-
24+ different protocols across different versions need detection
-
Context matters: The same SQL query means different things from different services
-
Missing context creates blind spots: Without enrichment, you’re analyzing raw bytes
Pattern matching with regex cannot handle this complexity. An intelligence layer is required to bridge eBPF’s raw data and the structured insights that security and operations teams need.
A single database query generates multiple packets. Let’s look at a concrete example with PostgreSQL:
Example: Running SELECT * FROM users WHERE email="admin@example.com" on PostgreSQL over SSL
Packet Breakdown (17+ packets total):
-
TCP handshake (3 packets):
-
SSL/TLS negotiation (4-6 packets):
-
ClientHello: Client proposes encryption
-
ServerHello, Certificate, ServerKeyExchange: Server responds
-
ClientKeyExchange, ChangeCipherSpec, Finished: Client confirms
-
ChangeCipherSpec, Finished: Server confirms
-
-
PostgreSQL startup (2-3 packets):
-
StartupMessage: Client sends protocol version, database name, user
-
Authentication request/response: Server challenges, client responds
-
ReadyForQuery: Server signals ready
-
-
Query execution (3-5 packets):
-
Parse: Client sends query string for parsing
-
Bind: Client binds parameters (if using prepared statement)
-
Describe, Execute: Client requests execution
-
Sync: Client requests synchronization
-
-
Query response (1-1000+ packets depending on result size):
-
RowDescription: Column metadata (name, type, size)
-
DataRow (×N): Each row of data (one packet per row for small rows, multiple for large)
-
CommandComplete:
SELECT 142(indicates 142 rows returned) -
ReadyForQuery: Server ready for next command
-
Each packet arrives separately, potentially milliseconds apart. To extract “the query” and its results, you need to:
-
Associate packets to connections: Track which packets belong together
-
Understand bi-directional flow: Match requests with their responses
-
Apply protocol knowledge: Use wire protocol specs to parse packet structure
-
Aggregate metadata: Combine information across multiple packets
Without packet correlation and protocol parsing, the raw data volume is unusable for data monitoring.
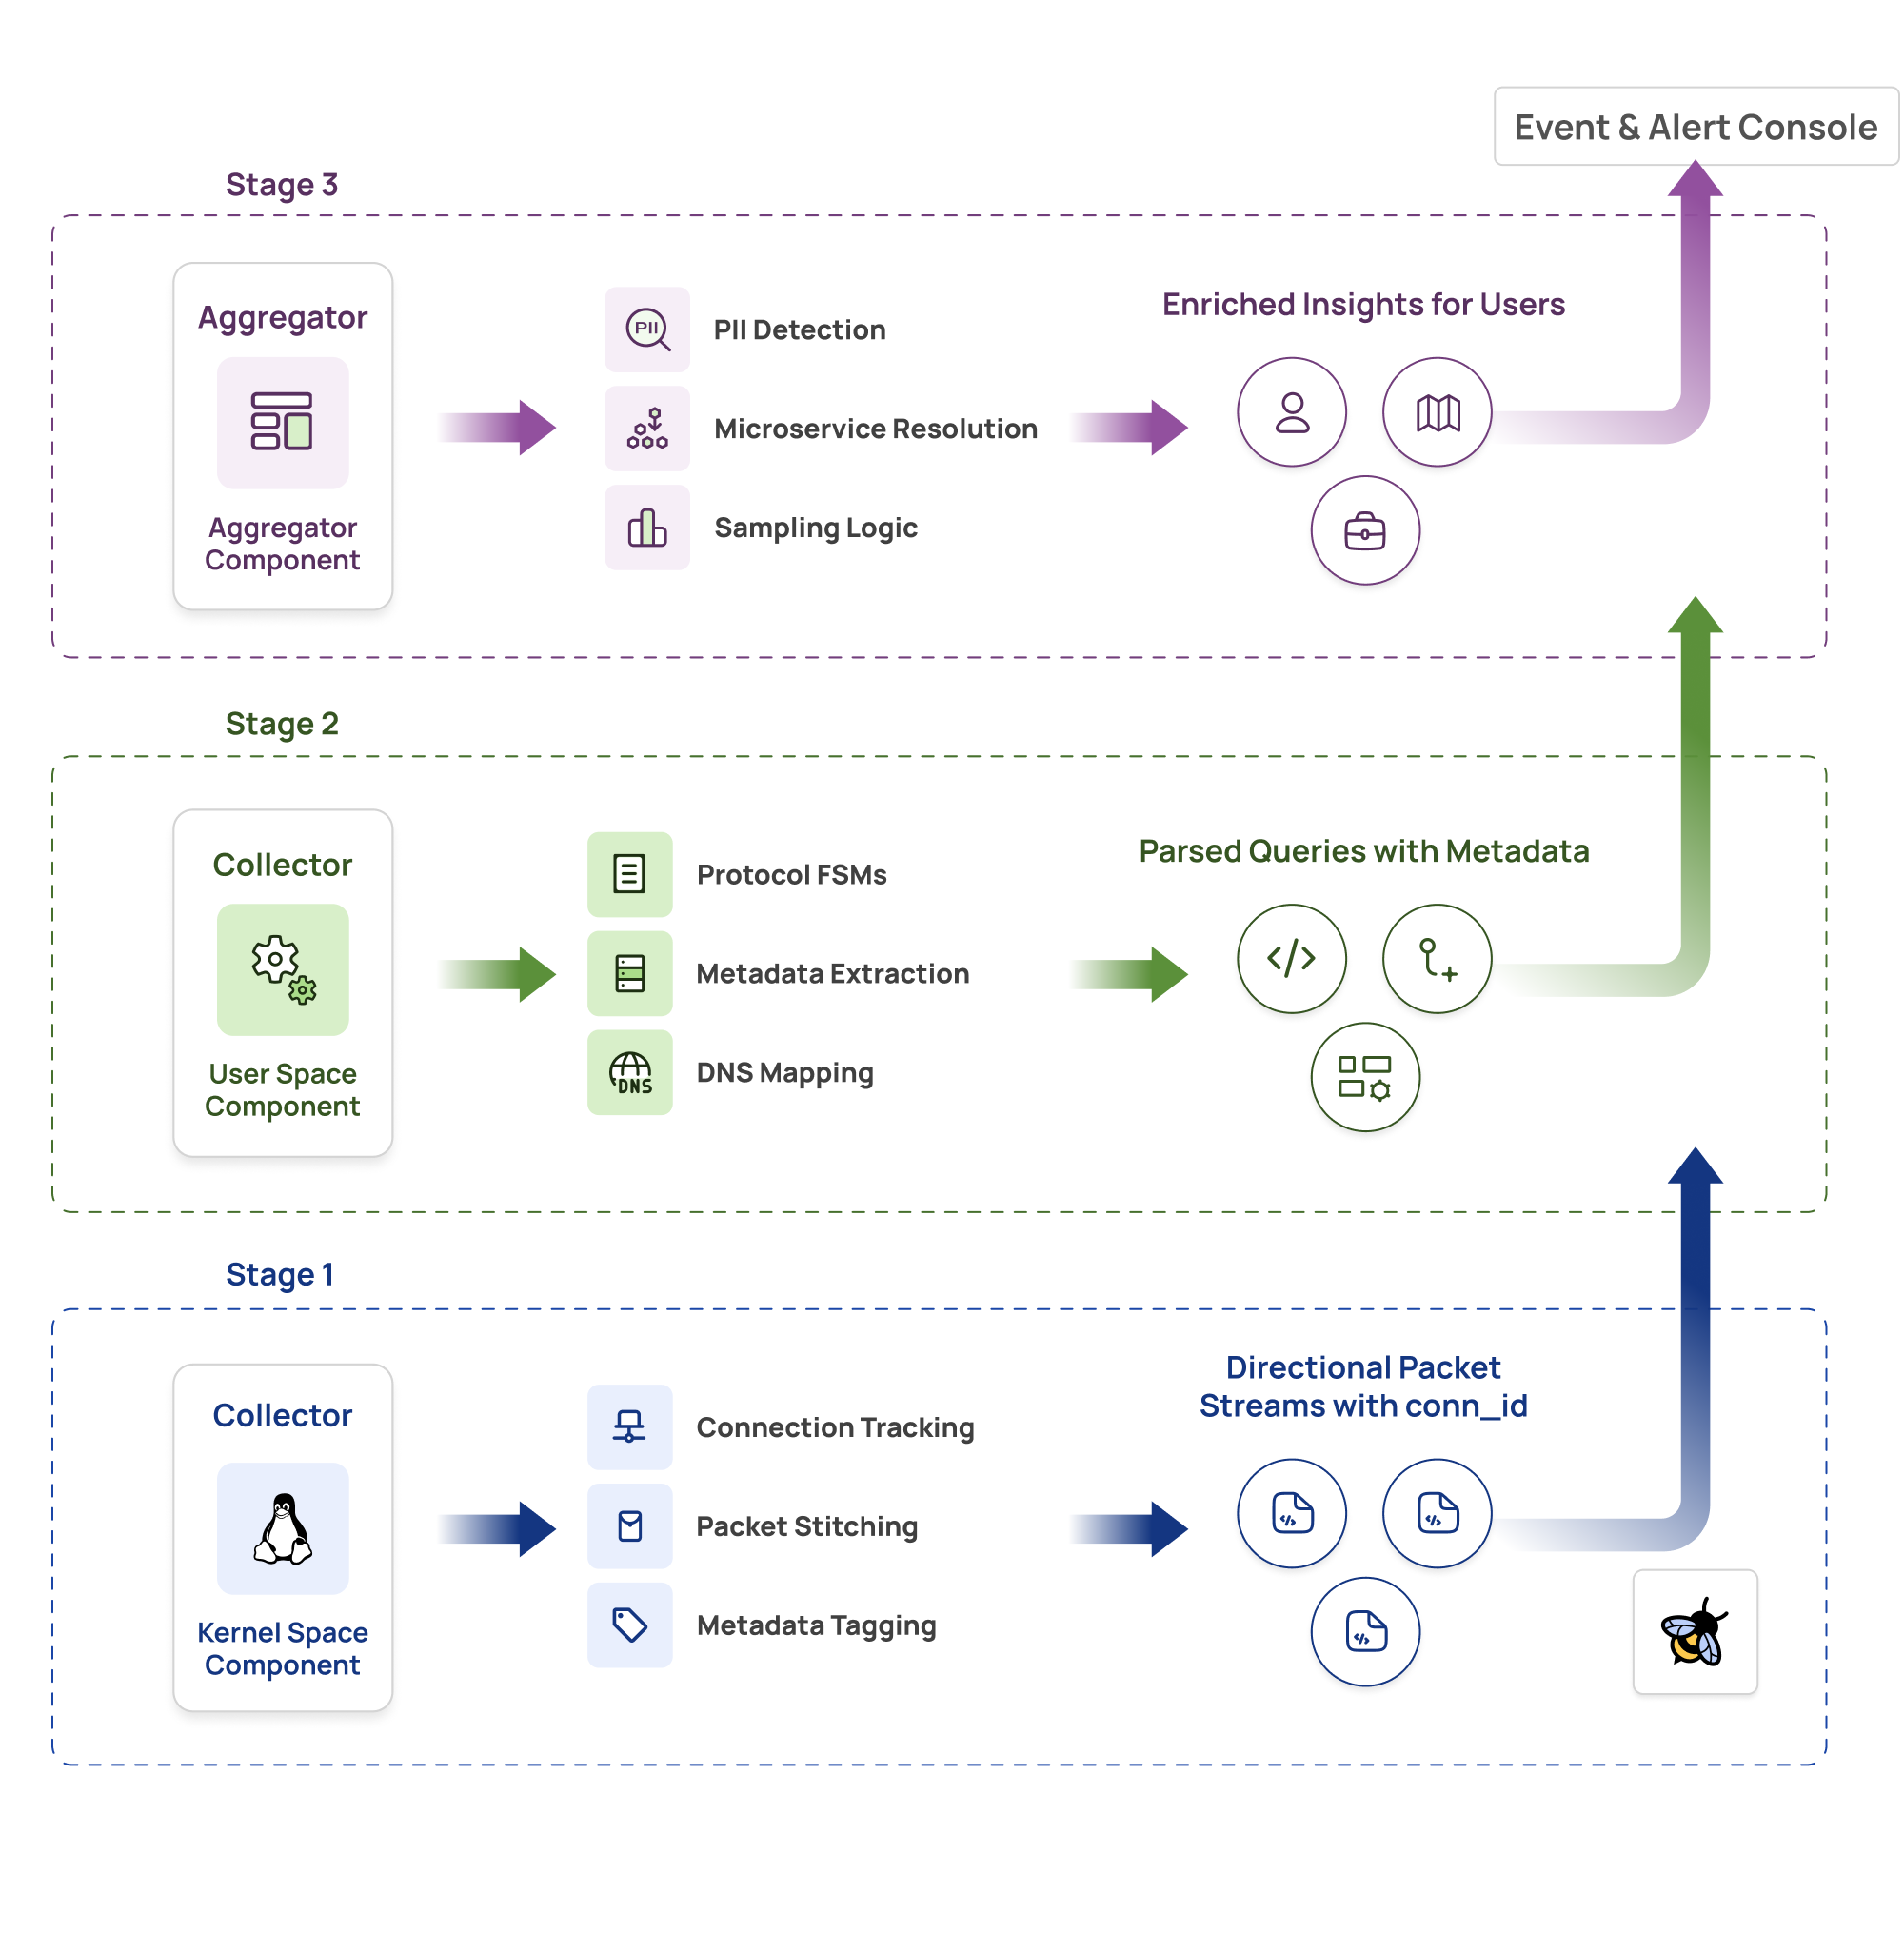
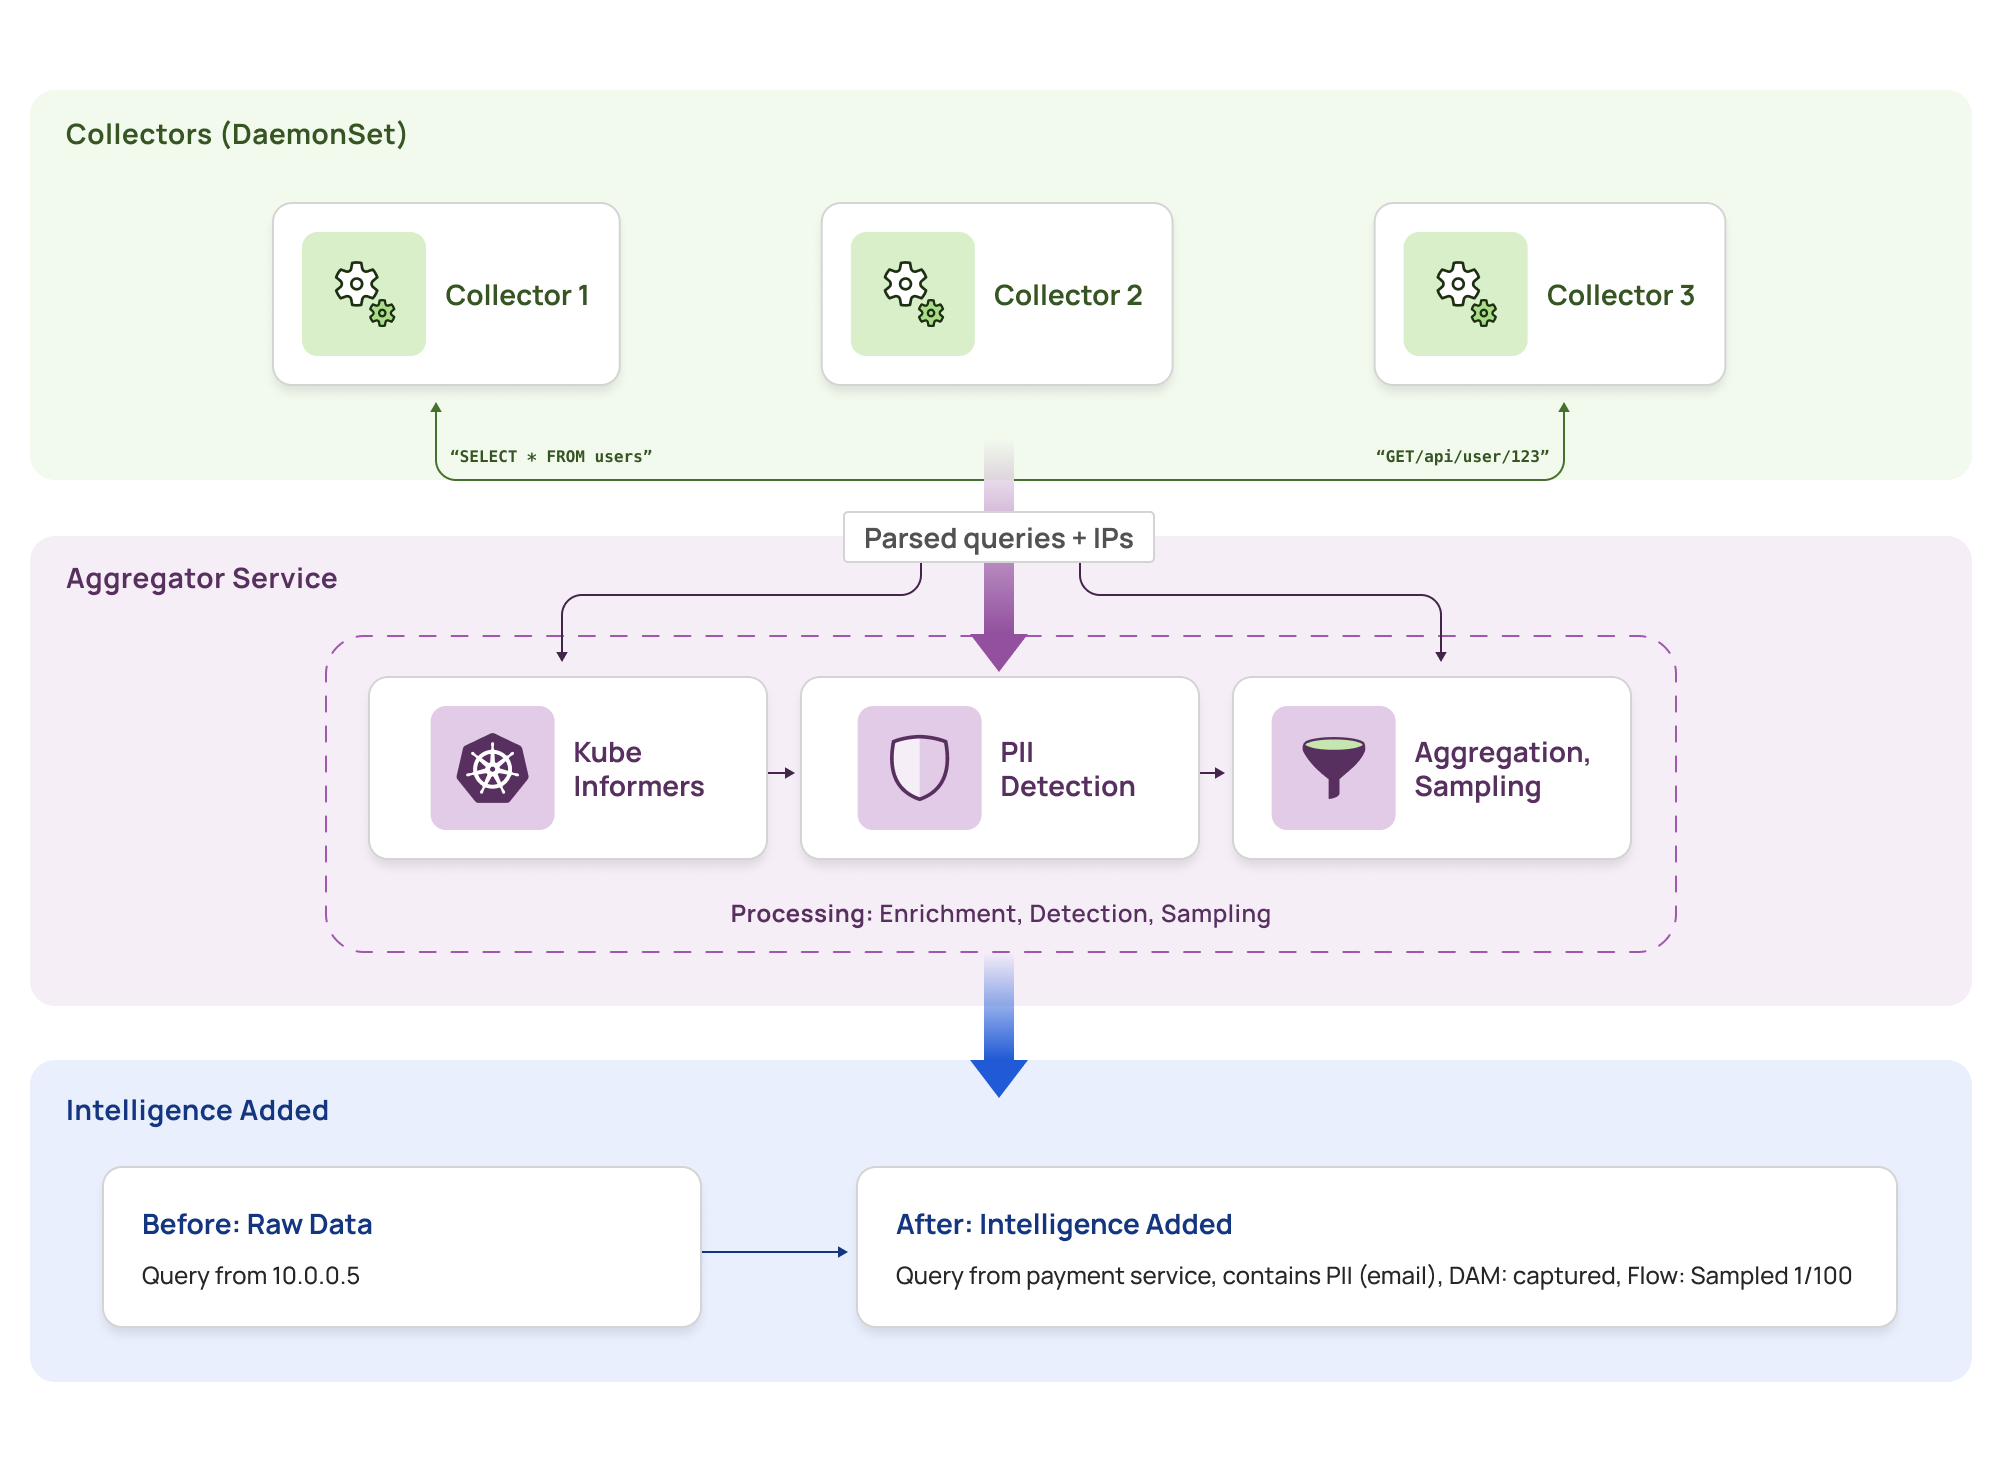
Our intelligence layer consists of two main components working together:
Collector (DaemonSet) – Runs on every node as an eBPF-based agent:
-
Kernel space (eBPF): Captures packets, tracks connections, tags traffic direction
-
User space: Parses protocols using FSMs, maintains DNS cache, performs initial aggregation
-
Reduces traffic at source by filtering and aggregating before sending to aggregator
Aggregator Service (Deployment) – Centralized enrichment with fixed pods:
-
Enriches parsed data with Kubernetes metadata (IP → pod → service mapping)
-
Detects PII using lightweight regex and ML models
-
Applies intelligent sampling and aggregation logic
The Flow: Raw packets → Collector (capture + parse + local aggregation) → Aggregator (enrich + analyze) → Actionable insights
This architecture consists of three processing stages, each addressing specific requirements of the eBPF data monitoring pipeline.
eBPF runs in the kernel, which means it’s fast but heavily constrained:
-
Verifier limitations: Can’t prove complex operations are safe
-
No loops (or very limited bounded loops)
-
Memory constraints: Can’t allocate large buffers
-
Instruction limits: Programs must be provably terminating
We explored these constraints in detail in our blog on how we unlocked 1000% performance gains by working with eBPF verifier limitations.
We can’t embed full protocol parsing or deep packet inspection in eBPF. So what can we do?
The kernel’s job is simple but critical:
Connection Tracking:
// Generate unique connection ID from tgid and fd
static inline uint64_t gen_tgid_fd(uint32_t tgid, uint32_t fd) {
    return ((uint64_t)tgid
Directional Packet Stitching:
For each packet on a connection:
  1. Lookup connection by conn_id
  2. Determine direction (based on socket state and syscall)
  3. Tag packet: REQUEST (egress) or RESPONSE (ingress)
  4. Send to userspace with conn_id and direction tag
This gives userspace a critical advantage: packets arrive pre-grouped by connection and tagged by direction. Instead of reassembling TCP streams from scratch, we get logical request/response pairs.
Why This Design?
-
eBPF does what eBPF does best: Fast lookups, simple state tracking
-
Complexity moved to userspace: Where we have no constraints
-
Efficient ring buffer usage: Only relevant packets sent (filtered early)
-
Unique per-process:
tgid + fdcombination is unique to each process’s view of a connection
Early on, we tried using regex to detect protocols and extract queries. This worked for simple cases but fell apart quickly:
-
MySQL packet headers have specific byte sequences that look like text
-
MongoDB BSON is binary-encoded, breaking string-based parsing
-
HTTP/2 and gRPC use binary framing, not plain text
-
SQL queries can span multiple packets, requiring reassembly
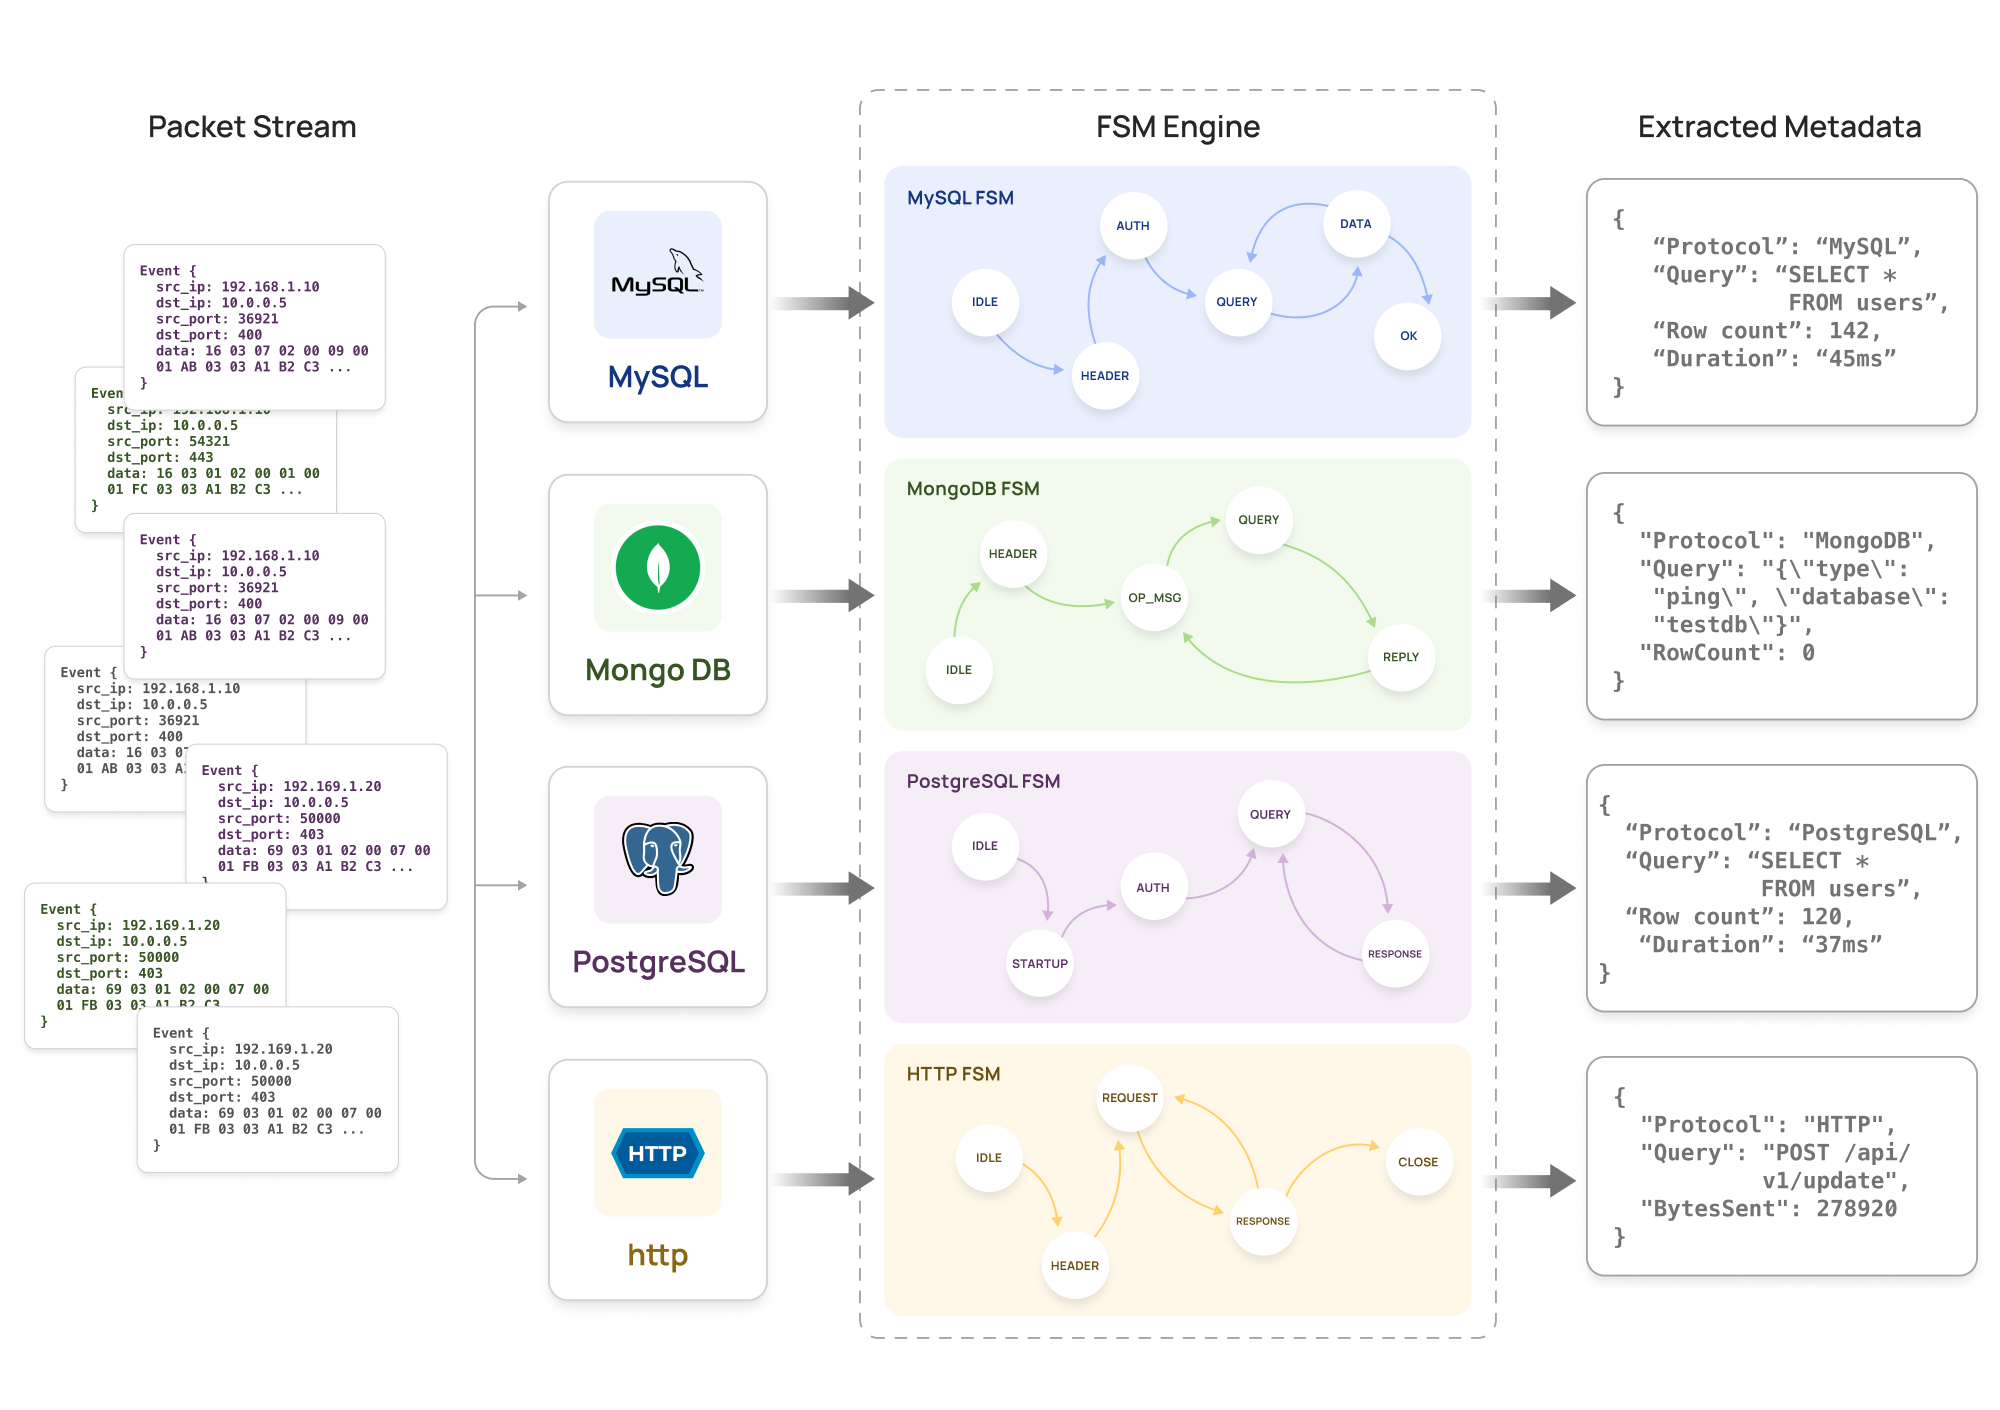
Regex-based parsing is unreliable for binary protocols and impossible to maintain across 24+ database wire protocols.
Each wire protocol is modeled as a Finite State Machine:
State Machine Example (MySQL):
  States: [IDLE, HANDSHAKE, AUTH, QUERY, RESPONSE, ERROR]

  Transitions:
    IDLE → HANDSHAKE: Server greeting packet
    HANDSHAKE → AUTH: Client auth packet
    AUTH → QUERY: Auth success
    QUERY → RESPONSE: Query packet received
    RESPONSE → QUERY: Response complete
How FSMs Work:
-
Each connection has its own FSM instance: Tracks protocol state independently
-
Packets advance the state: Based on protocol-specific markers (packet type, magic bytes, headers)
-
Metadata extracted at specific states:
-
In QUERY state: Extract SQL query string
-
In RESPONSE state: Extract row count, column metadata
-
In ERROR state: Extract error codes
-
Why FSMs?
-
Protocol-aware: Each protocol’s wire format is explicitly modeled
-
Stateful: Handles multi-packet queries and responses correctly
-
Extensible: Adding a new protocol means adding a new FSM
-
Deterministic: Same packet sequence always produces same result
We track DNS events from the kernel but maintain a userspace DNS cache:
Why not in kernel?
-
Strings are hard to work with: Domain names are variable-length strings, difficult to handle efficiently in eBPF
-
Fixed-size limitation: BPF maps have fixed sizes, but DNS cache needs to grow/shrink dynamically with traffic
-
TTL-based expiry: Time-based cache expiration is complex in kernel space
How it works:
DNS Cache (Userspace):
  On DNS response packet:
    1. Parse domain name and IP address
    2. Store in cache: domain → IP (with TTL)
    3. Reverse mapping: IP → domain

  When enriching packets:
    1. Lookup dest_ip in cache
    2. Attach domain name to metadata
    3. Handle misses: fall back to IP address
This solves the “IP to domain” problem cleanly, with cache efficiency tuned for our workload.
Not all data needs to go to the aggregator. We perform initial aggregation at the collector to reduce network traffic:
What collectors aggregate locally:
-
Connection-level metrics: Bytes sent/received, packet counts, duration
-
Query patterns: Group similar queries by template (e.g.,
SELECT * FROM users WHERE id = ?) -
Flow statistics: Aggregate flows by (src, dst, protocol) over time windows
-
Sampling decisions: Apply sampling rules early to drop redundant data
What still goes to the aggregator:
-
Full queries for DAM: Every database query text (compliance requirement)
-
PII-flagged data: Queries that match PII patterns need centralized detection
-
Kubernetes enrichment: IP addresses need pod/service resolution
-
Anomalous traffic: Errors, unusual patterns, first-time-seen queries
Why this matters:
-
90% traffic reduction: Most flow data aggregated at collector
-
Lower aggregator load: Centralized service handles only enrichment-critical data
-
Better scalability: Network bandwidth between collectors and aggregator doesn’t become bottleneck
This staged aggregation strategy lets us scale to billions of queries without overwhelming the network.
Initially, we ran Kubernetes informers directly in the collector (DaemonSet, one per node). This caused problems:
-
Heavy DaemonSet: Each collector cached full Kubernetes state
-
Memory bloat: Scales linearly with number of nodes
-
Duplicate work: Multiple collectors watching the same Kubernetes API
We moved Kube informers and PII detection to a centralized aggregator service:
Kube Informers (Microservice Resolution):
-
Aggregator maintains a single cache of Kubernetes pod → service mappings
-
Collectors send IP addresses to aggregator
-
Aggregator resolves: IP → Pod → Service → Microservice name
-
Scales independently of node count
PII Detection (Lightweight Regex + ML):
-
Collectors send raw queries to aggregator
-
Aggregator runs lightweight regex patterns and ML models on queries
-
Detects: SSNs, credit cards, email addresses, phone numbers
-
Returns: PII tags and confidence scores
Why This Design?
-
Fixed resource usage: Aggregator pods can be sized predictably
-
Centralized intelligence: One source of truth for pod/service mappings
-
Collectors stay lightweight: Focus on packet capture and parsing
-
Independent scaling: Aggregator scales with query volume, not node count
At 20 billion queries per day, we can’t keep everything. We aggregate and sample based on use case:
For Database Activity Monitoring (DAM):
-
Capture everything: Every query matters for compliance and security
-
Store full query text, parameters, result count, and column metadata
-
Enable deep forensic analysis
For Application Flow Tracking (App-to-App, Egress, AI-App Detection):
-
Aggregate by flow characteristics:
-
Group by (src_service, dst_service) for general traffic
-
Include http_path for HTTP traffic granularity
-
-
Compute flow metrics:
-
Sample proportionally: Common flows sampled at lower rate
-
Reduces storage by 90% while retaining traffic patterns
-
Always keep: Queries with errors, PII detected, anomalous patterns
This sampling strategy preserves security-critical signals while managing storage and processing costs at scale.
Problem: DNS events can be missed (high traffic volume, event drops, timing issues)
Solution: Maintain a user-space DNS cache with intelligent fallback:
-
Primary: DNS events from eBPF
-
Fallback: Reverse DNS lookup (cached)
-
Last resort: IP address as-is (still useful with Kube informers)
Problem: eBPF sees encrypted bytes, not cleartext queries
Solution: uprobes on SSL_read/SSL_write:
-
Intercept SSL library functions in userspace
-
Capture cleartext before encryption / after decryption
-
Associate with connection using fd (file descriptor)
This gives us full visibility into encrypted traffic without breaking SSL. We covered the challenges of SSL/TLS monitoring in depth in The SSL/TLS Trap: Why Your Data Security Goes Blind in Production.
Problem: Some protocols have generic patterns that can cause false detection
Example: TLS handshake looks similar across protocols (MySQL, PostgreSQL, HTTP all use TLS)
Solution: Multi-stage classification with fallback:
-
Initial detection: FSM identifies potential protocol from packet patterns
-
Wait for clear identifier: Look for protocol-specific startup packet after handshake
-
MySQL: Server greeting with version string
-
PostgreSQL: Startup message with protocol version
-
MongoDB: OpMsg with specific flags
-
-
Fallback to standard ports: If ambiguous, use port as tiebreaker
-
Validate continuously: Ensure subsequent packets match the identified protocol
This reduces false positives while maintaining high detection accuracy.
Problem: Determining which process actually owns and uses a connection is harder than it seems
Challenges:
Connection ownership mismatch:
-
The process that accepts a connection isn’t always the one that maintains it
-
Example: PostgreSQL uses a forked process model – the parent
postgresprocess accepts connections, then forks child processes that handle individual client sessions -
We can’t assume
accept()syscall identifies the actual session owner
Misleading metadata:
-
Process name and command line often reflect the server process, not the actual acting client/actor
-
A connection accepted by
postgresmight be serving requests from the payment service, analytics pipeline, or admin tool -
Standard process metadata (pid, tgid, comm) doesn’t tell us the client identity
Solution: Multi-signal correlation:
-
Track the full process tree: Follow forks from parent
postgresto child session processes -
Use connection state: Infer ownership based on whether process called
connect()(egress/client) oraccept()(ingress/server) -
Combine with application context: Use Kubernetes pod metadata and service discovery to identify the actual actor
-
Bidirectional flow analysis: Track both sides of the connection to determine request initiator
This approach correctly identifies “the payment service is querying PostgreSQL” rather than just “postgres process has network activity.”
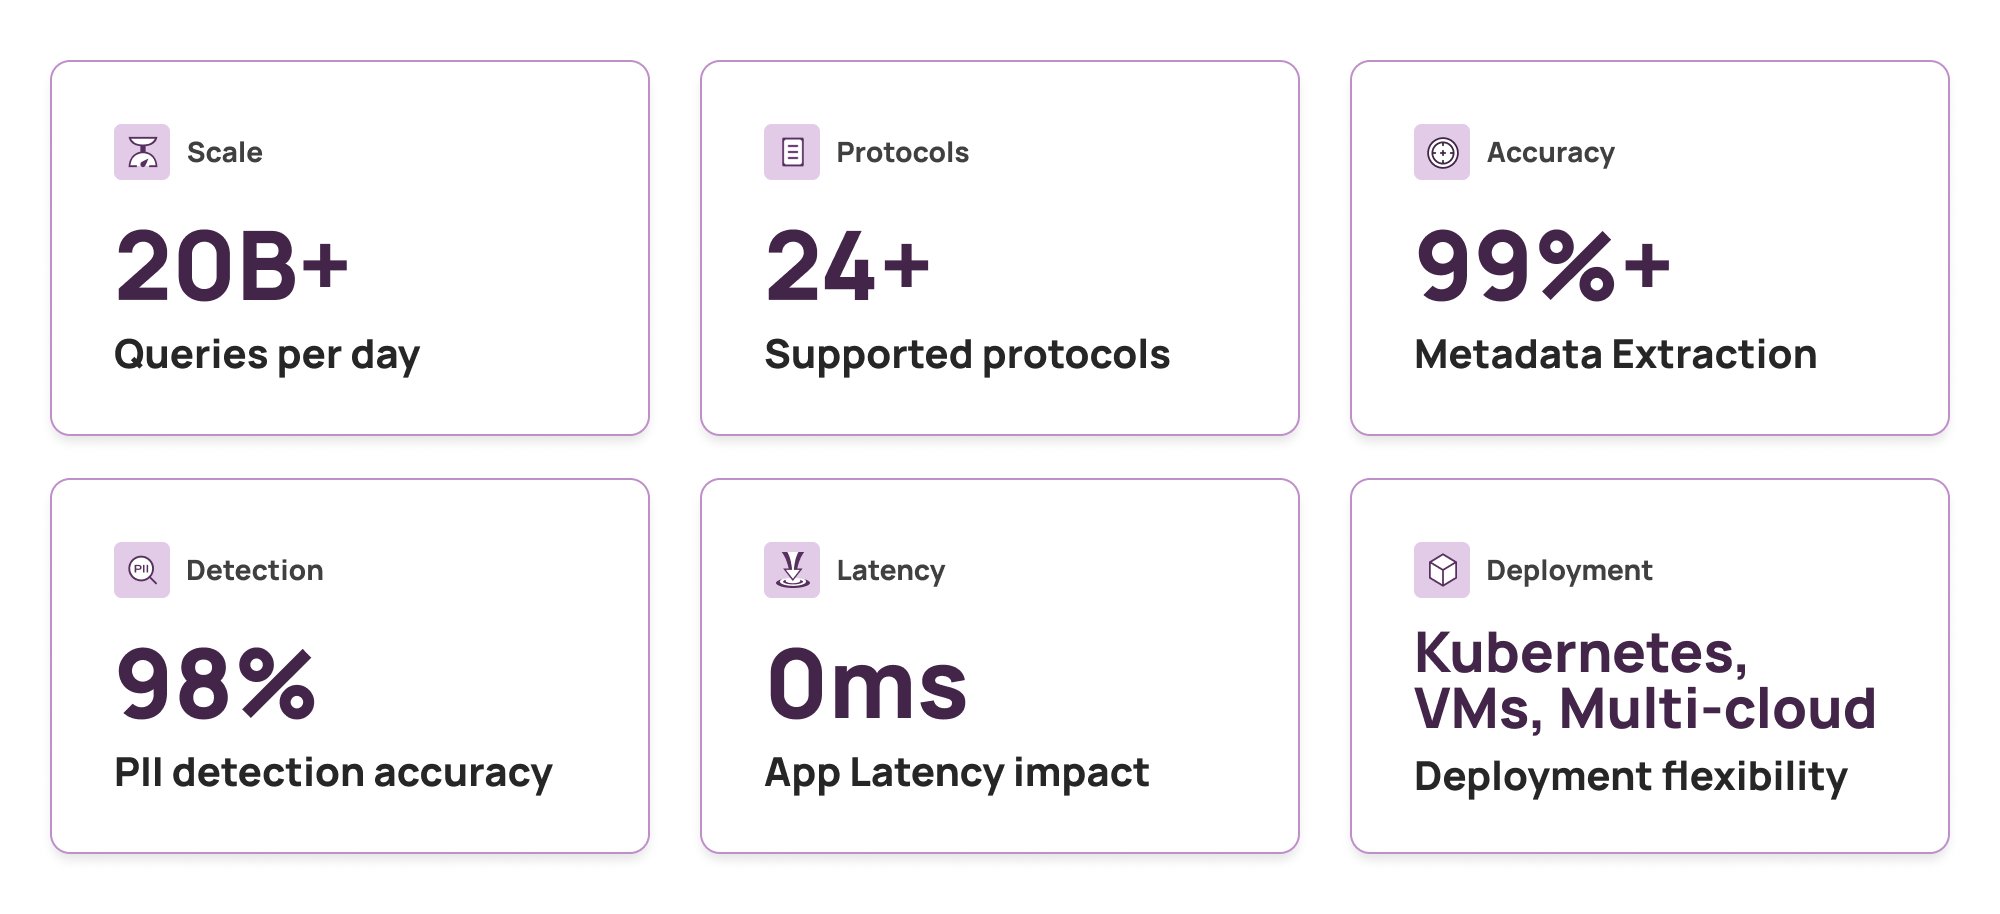
-
Queries processed per day: 20+ billion
-
Protocols supported: 24+ (across different versions)
-
Deployment modes: Kubernetes, VMs, on-prem, multi-cloud
-
PII detection accuracy: >98%
-
Metadata extraction success rate: >99% for supported protocols
-
Application latency impact:
Our intelligence layer enables customers to:
-
Detect sensitive data access in real-time: “Alert me when production PII is accessed from dev environment”
-
Audit access patterns: “Show me all microservices accessing the payments database”
-
Comply with regulations: “Generate reports of all SSN access by service and user”
-
Debug production issues: “What queries did the checkout service run during the incident?”
For more on how Database Activity Monitoring turns raw data into debugging signals, see How DAM Turns Database Blind Spots into Rapid Debugging Signals.
Customers use this to:
-
Identify unauthorized data access: Detect when decommissioned services still have credentials
-
Find PII leakage: Discover when query logs with PII are sent to external observability platforms
-
Map service dependencies: Understand which microservices access which data stores and APIs
-
Investigate incidents: Trace query patterns during outages or security events
All of this happens at scale, with no added latency to customer applications.
Beyond protocol parsing, we want richer context:
-
Track connection lifecycle: From DNS lookup → connect() → query → close
-
Correlation with system calls: Link file operations, process forks, network calls
-
Session-level aggregation: Group related connections (connection pools, load balancing)
This enables questions like “What file did the app read before running this query?”
Protocols evolve (MySQL 5.7 vs 8.0, PostgreSQL 12 vs 16). We’re building:
-
Dynamic FSM selection: Detect protocol version during handshake
-
Version-specific parsers: Handle wire format differences automatically
-
Backward compatibility: Support older protocol versions without code changes
This reduces maintenance burden as databases evolve.
As AI applications proliferate, we need better classification:
-
AI agent detection: Identify agentic workflows and their database access patterns
-
MCP server identification: Recognize Model Context Protocol servers and their data flows
-
AI orchestrator tracking: Distinguish orchestration layers (LangChain, LlamaIndex, etc.)
-
Vector database support: Extend FSMs to Pinecone, Weaviate, Milvus protocols
This enables insights like “Which AI agents are accessing production customer data?” and “What context is being fetched for this LLM call?”
We’re building on this with AIOStack at Aurva.ai – our platform for AI observability and security.
eBPF provides raw packet visibility at the kernel level. Converting that visibility into data monitoring and security insights requires a dedicated intelligence layer.
Our intelligence layer transforms:
-
Packets → Connections (via conn_id: tgid + fd)
-
Connections → Protocols (via FSM classification)
-
Protocols → Queries (via wire protocol parsing)
-
Queries → Insights (via PII detection, service resolution, aggregation)
At 20+ billion queries per day, across 24+ protocols, in production environments processing millions of transactions, this architecture works.
The key insights:
-
eBPF is an enabler, not the solution: Use it for what it’s good at (fast, kernel-level capture)
-
Staged processing wins: Kernel tracks, userspace parses, aggregator enriches
-
FSMs are worth it: Protocol knowledge encoded explicitly beats fragile regex
-
Centralize intelligence: Scales better than duplicating work across collectors
-
Design for workload: DAM captures everything; flow tracking samples intelligently
If you’re building on eBPF, don’t stop at packet capture. Build the intelligence layer that makes those packets actionable.
An eBPF intelligence layer is a software component that sits between raw eBPF packet captures and user-facing data monitoring tools. It transforms low-level packet data into structured, actionable information by performing protocol detection, query and API extraction, PII detection, and metadata enrichment.
eBPF data monitoring works by attaching programs to kernel events (socket operations, system calls) to capture network packets without modifying application code. These packets are then processed through protocol parsers (typically using finite state machines) to extract database queries, API calls, and metadata.
Finite State Machines handle the stateful nature of database wire protocols, where a single query spans multiple packets and requires tracking connection state. Regex fails for binary protocols (MongoDB BSON, HTTP/2), multi-packet queries, and protocols with similar-looking packet structures.
Yes. eBPF can monitor encrypted connections by using uprobes on SSL library functions (SSL_read, SSL_write). This captures cleartext data before encryption or after decryption without breaking TLS or requiring certificate injection. Check out our blog on this very topic.
PII detection at scale requires a combination of lightweight regex patterns for structured data (SSNs, credit card numbers, phone formats) and ML models for unstructured PII (names, addresses). Running detection in a centralized aggregator avoids duplicating processing across distributed collectors.
Building observability or security tools on eBPF? We’re interested in hearing about your approach to the intelligence layer, what challenges you’ve encountered and what design decisions have worked.