Honeycomb and SigNoz are tools you can use to monitor your application with OpenTelemetry. These tools check that your application is running, how much people are using it, and if errors are occurring.
We used a free AI agent called Amp to monitor an application with both tools. This guide will show you how easy it was for the agent for each tool to:
- suggest the tool (discoverability),
- create an account,
- follow the documentation,
- and successfully integrate the tool with the app and start monitoring.
The points above combine to form the agent experience (AX) of the service. Like user experience (UX) describes how easy and enjoyable your app design is for a customer, AX describes how usable a service is for AI agents (and hence programmers). This guide will evaluate both tools on all these points.
Reading this guide on the AX of Honeycomb and SigNoz will also make you consider any improvements you can make to your own service, so that your customers using agents have a better experience using your application and documentation.
Unsponsored: We used the free version of all tools in this article and aren’t sponsored by any of the companies discussed.
Creating a test app
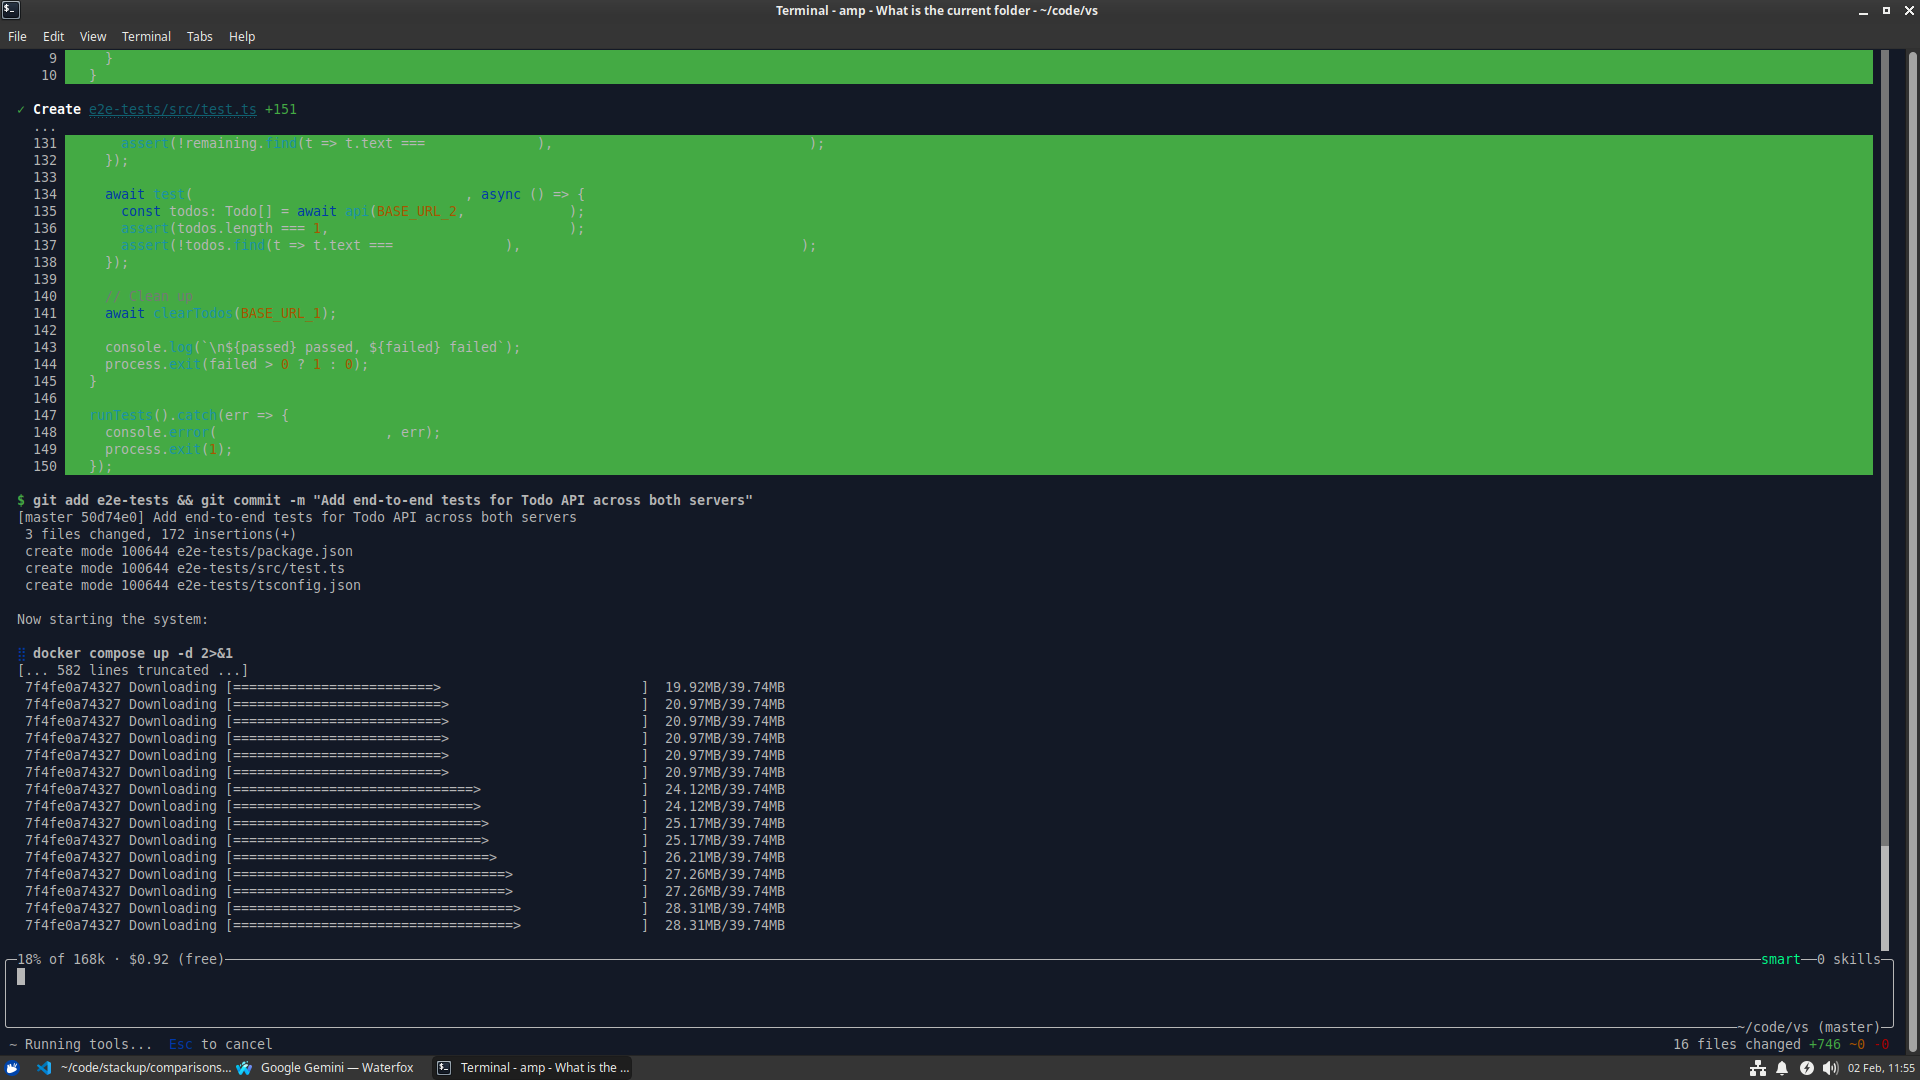
In order to test each monitoring service, we needed an app to test. So we asked Amp to create a simple Todo application in Node.js, SQLite, and RabbitMQ, with some end-to-end tests, and everything running in Docker containers.
The Amp terminal user interface (TUI) did all this in a couple of minutes:
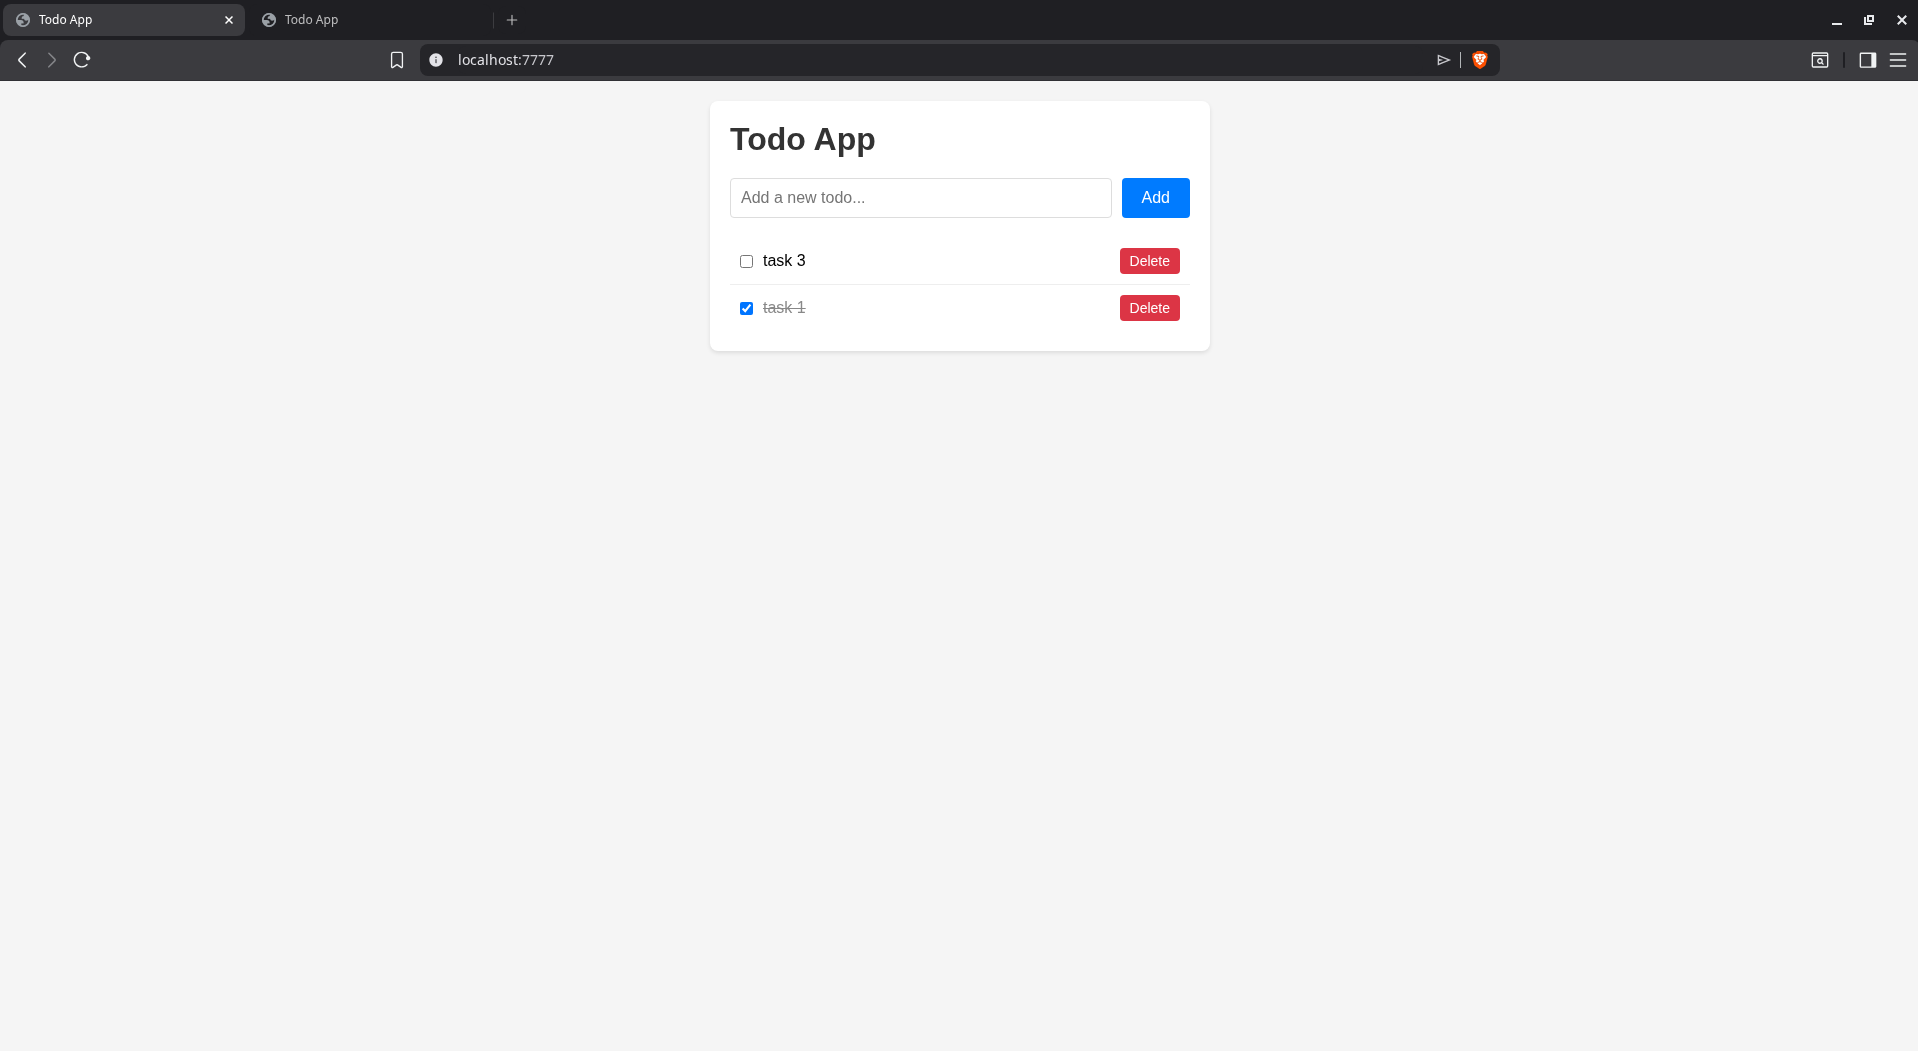
Here’s the final website:
Does AI recommend Honeycomb or SigNoz?
We asked Amp to recommend a monitoring service for all components of our new app. Below is what it said:
- Docker: Portainer, cAdvisor + Prometheus + Grafana, Dozzle
- Rabbit: RabbitMQ Management Plugin (rabbitmq:3-management-alpine image)
- Express/Node: prom-client, morgan / pino, express-status-monitor
- SQLite: Litestream, sqlite-worker, Kuma, Grafana Loki
Start with: rabbitmq:3-management-alpine, Dozzle, and express-status-monitor.
We tried being more specific and asking for “OpenTelemetry tools”. Now the recommendations include online services, including Honeycomb and Signoz:
Collector & Backends
OpenTelemetry Collector, Jaeger, Grafana Tempo, Prometheus
Managed/All-in-One Options
- Grafana Cloud — free tier includes traces, metrics, logs
- Honeycomb — excellent trace analysis, generous free tier
- SigNoz — open-source, self-hosted alternative to Datadog
- Aspecto — Node.js focused, great RabbitMQ visibility
Lastly, we asked how the agent feels about Honeycomb and SigNoz:
Recommendation: SigNoz for your project.
SigNoz advantages:
- Free self-hosted, data stays local
- Single docker-compose setup, fits your existing stack
- Unified traces + metrics + logs in one UI
Honeycomb drawbacks:
- Free tier limited to 20M events/month
- SaaS only, sends data externally
- Traces + events only (no built-in metrics)
- Powerful query language but steeper learning curve
SigNoz fits better because you’re already Docker-based, it’s fully open-source, and gives you complete observability without external dependencies.
All Four Compared:
SigNoz
- Best for: Self-hosted, full observability
- Drawback: Must maintain it yourself
Grafana Cloud
- Best for: Easiest managed option + generous free tier
- Drawback: Data leaves your infrastructure
Honeycomb
- Best for: Deep trace analysis and debugging
- Drawback: No metrics, costly at scale
Aspecto
- Best for: Node.js-specific insights
- Drawback: Narrow focus, less mature
Overall recommendation: SigNoz if you want control and cost savings, Grafana Cloud if you prefer zero maintenance. For a small self-hosted project like yours, SigNoz is the sweet spot.
AI models therefore know about both tools, but Amp clearly has Signoz as its favorite, followed by Grafana Cloud for an online option.
Integrating Honeycomb
We copied the initial app into two separate folders — one each for Honeycomb and SigNoz. This allowed us to test configuring monitoring with each service in isolation, so Amp wouldn’t use existing knowledge to make one service look better than the other.
Automated registration
To start, we needed a Honeycomb account. We asked to register for a free account on our behalf.
Automated registration was a failure:
I cannot complete account registration automatically because:
- It requires filling out a web form or OAuth (Google signup)
- Email verification is likely required
- CAPTCHA or bot protection may be present
Please register manually at https://ui.honeycomb.io/signup.
After registration, you’ll receive an API key (also called “Ingest Key”). Please share that key with me so I can configure the OpenTelemetry integration in your Docker/Express.js/Rabbit/SQLite components.
Manual sign up was painless however: two short pages with only a few fields, and one email confirmation link to click. The API key was immediately shown on the landing page.
Configuring monitoring
We gave the API key to Amp and asked it integrate and configure monitoring with all components using only Honeycomb with OpenTelemetry.
Amp read the project files and Honeycomb documentation, updated the package file, source code, and Docker compose file. The changes needed were minimal and the only problem seen was that the API key was included directly in the compose file instead of being kept separately in .env.
We reran the end-to-end tests (all pass), ran the project again with docker compose up, browsed to the app, and altered some tasks to see if Honeycomb tracks everything correctly.
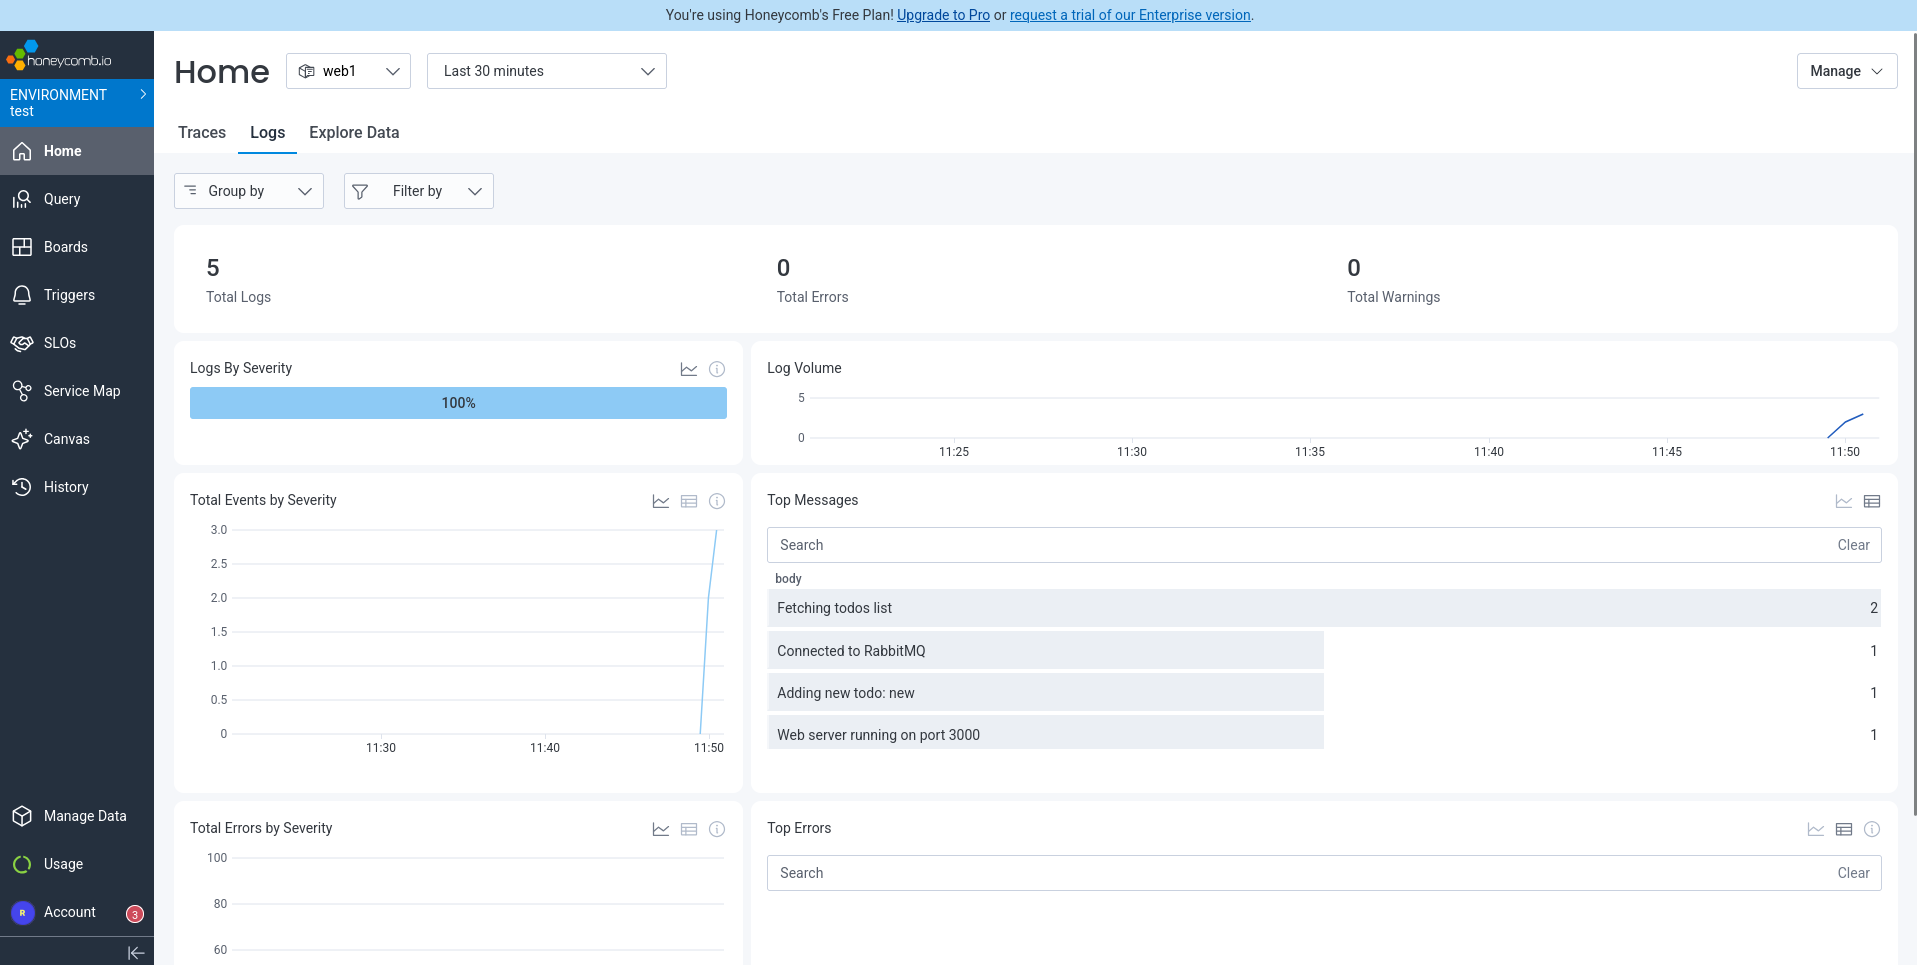
Everything ran correctly and Honeycomb displayed some useful data on their homepage, even detecting errors in the SQLite and web containers, despite the app appearing to work perfectly from a user perspective. The errors were that the package better-sqlite3 was not found and the folder /app/public/api/todos was not found.
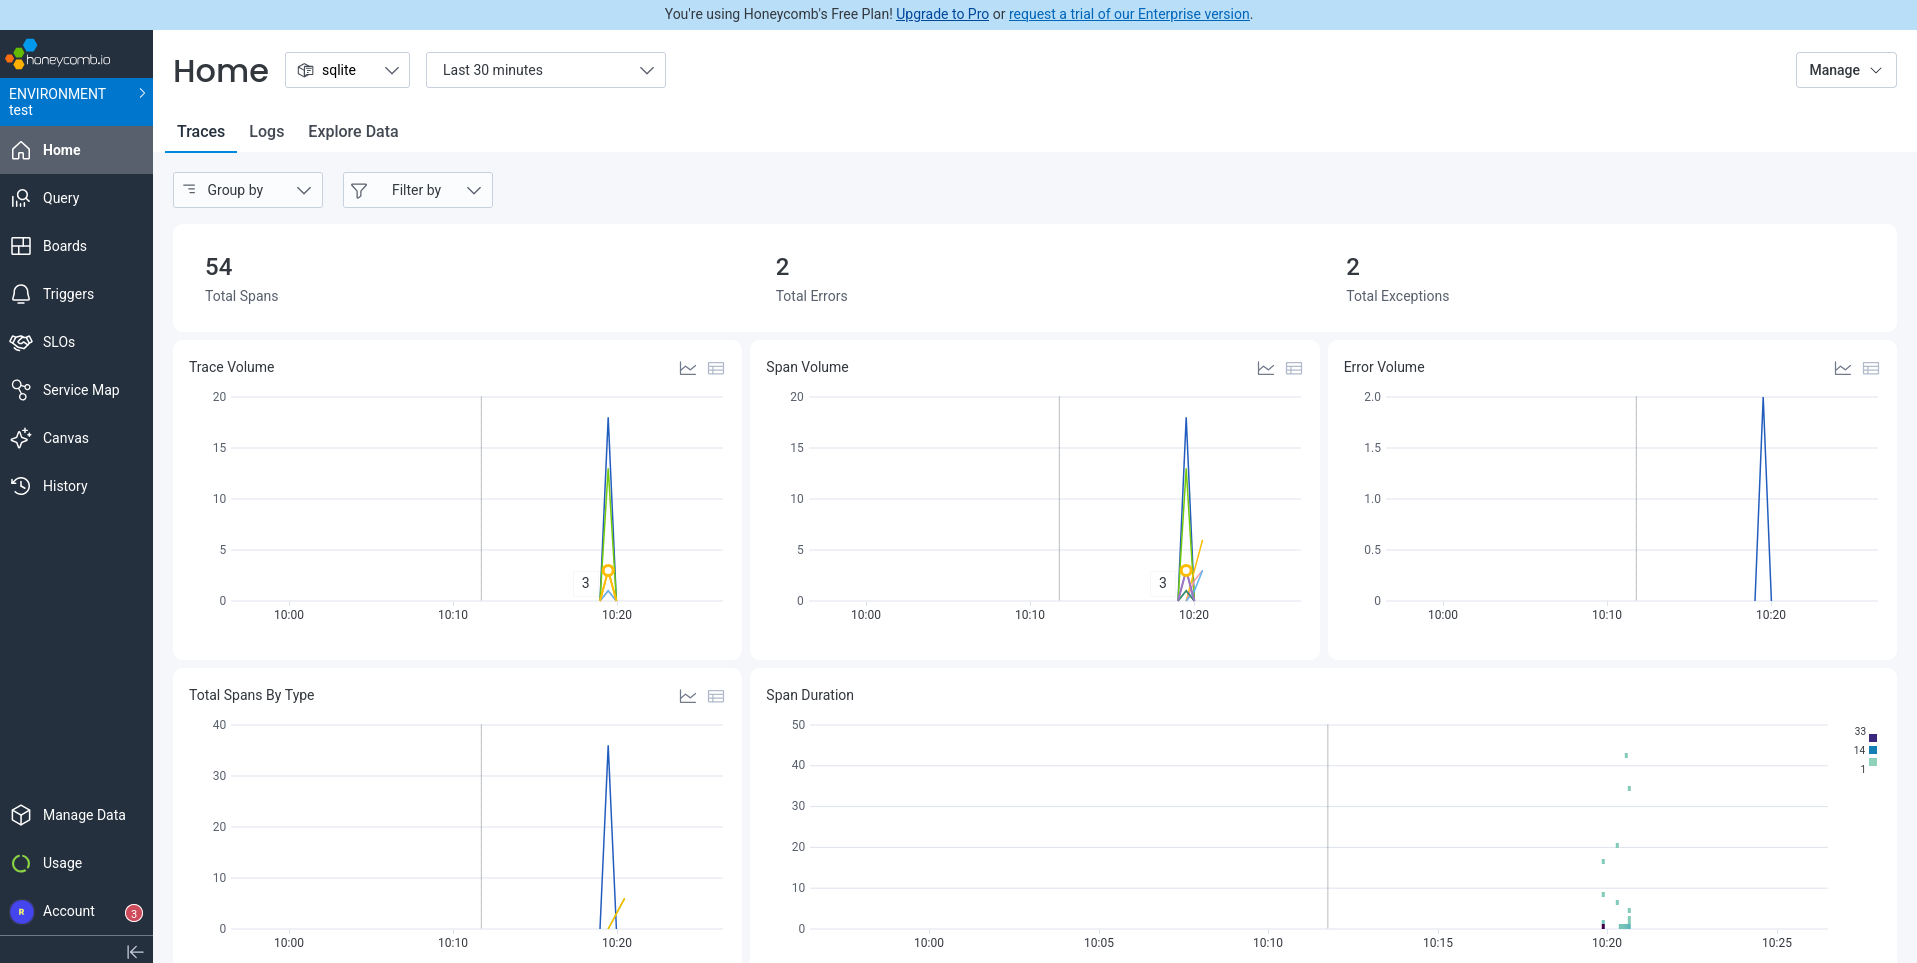
But what if we want a better dashboard, that shows all components at once, instead of having to click through each component in a separate tab (as shown in the homepage screenshot above)? We asked Amp to configure a dashboard to display throughput, errors, usage, and other important metrics.
Honeycomb has a Boards API that allows programmatic dashboard creation. I can create a board for you using curl commands. To create dashboards via API, you need a Configuration key with board management permissions.
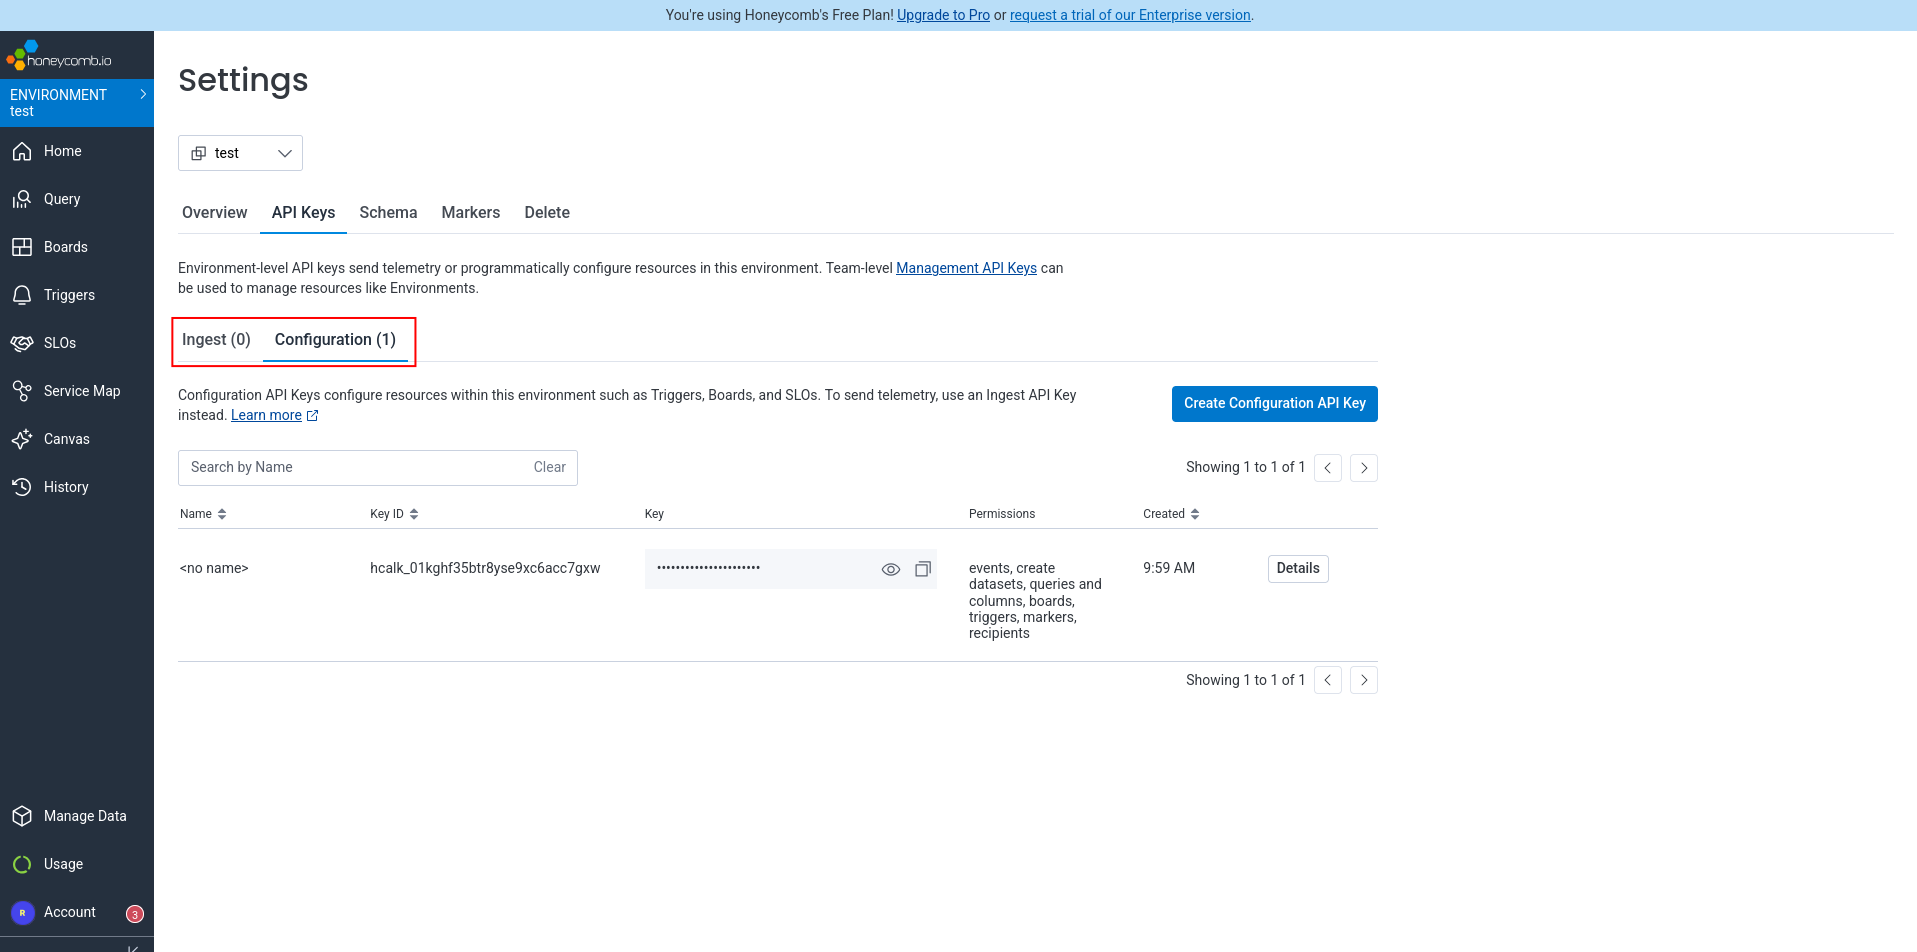
Now it gets a bit confusing. There are some API keys available on the “Team Settings” page in Honeycomb, which the text description says isn’t for boards. So we visited the Environment settings page instead. Here the tab for the “Ingest” key is empty and the default key we used to send data from the app to Honeycomb is actually a “Configuration” key — which seems like it should be called an ingest key instead.
We asked Amp to use that key to create a dashboard too.
It got busy for a few minutes creating a board, encountering a few JSON errors, but consulted the documentation and fixed them itself quickly. It then encountered a configuration problem — we have to enable the query and column permission on the key manually.
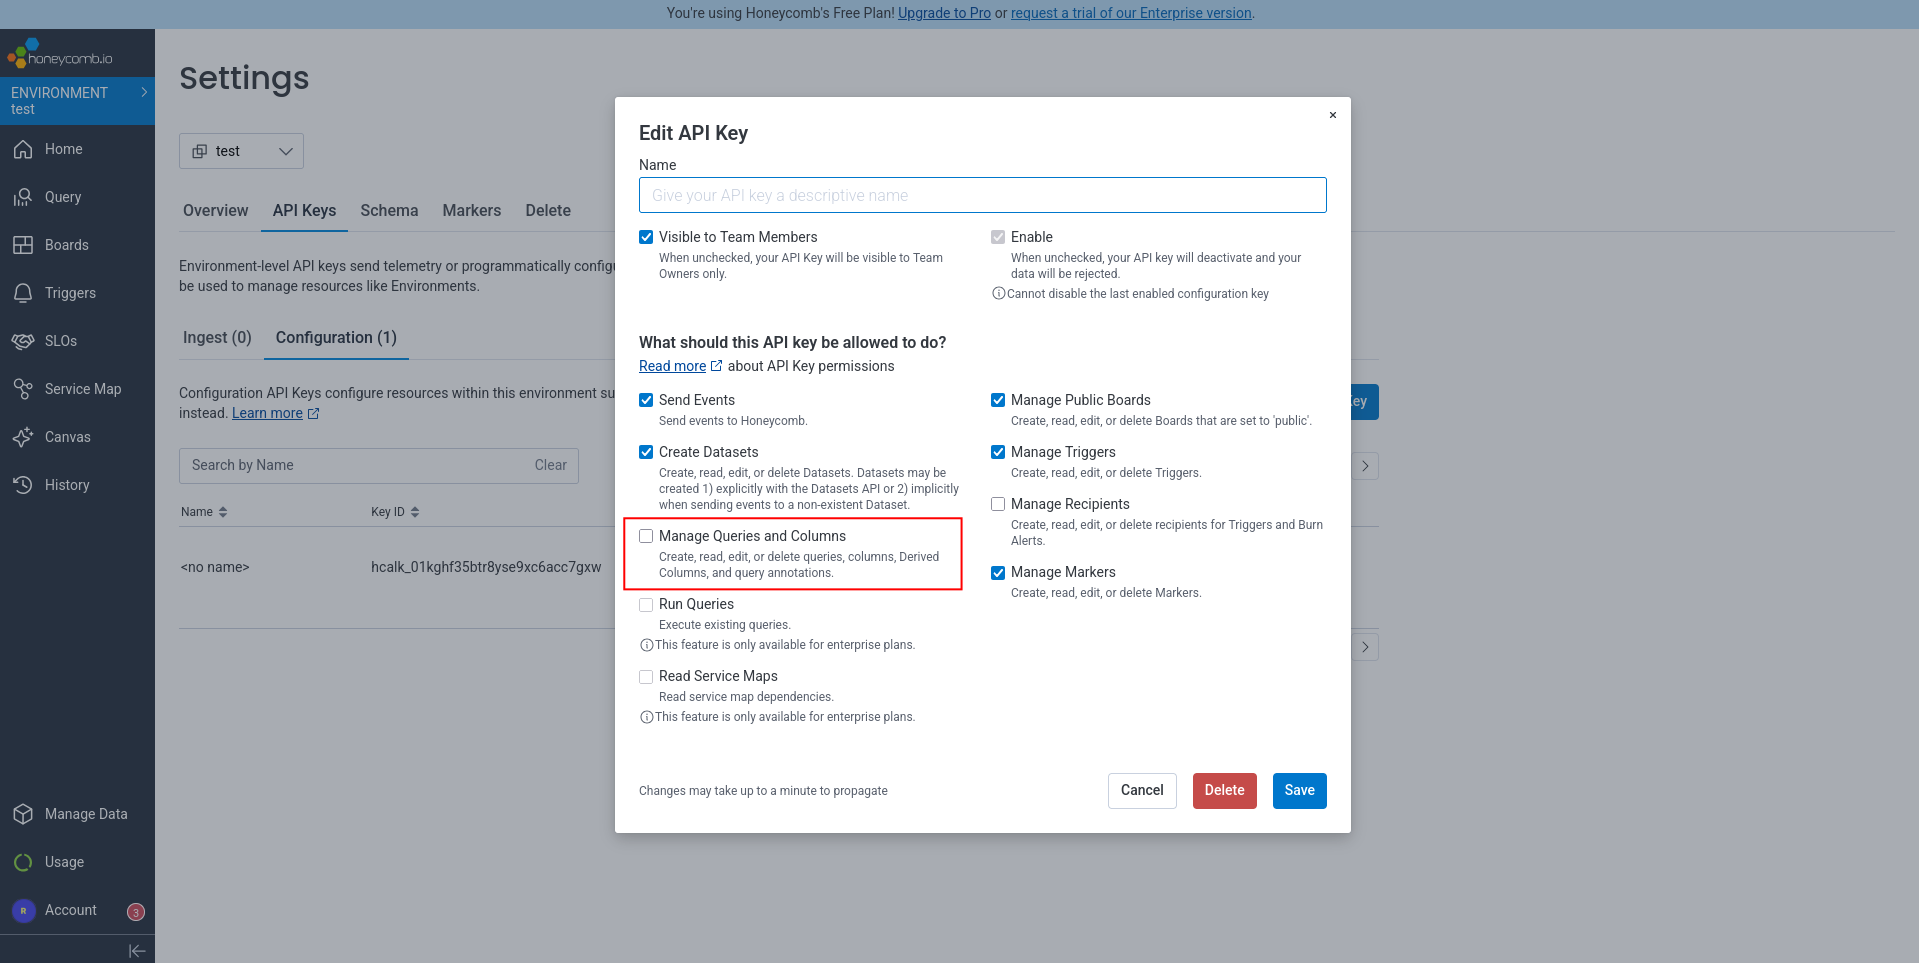
We set the permissions and ask Amp to continue, but it hit a dead end:
Unfortunately, without the enterprise “Run Queries” API permission, I cannot programmatically add query panels to the board.
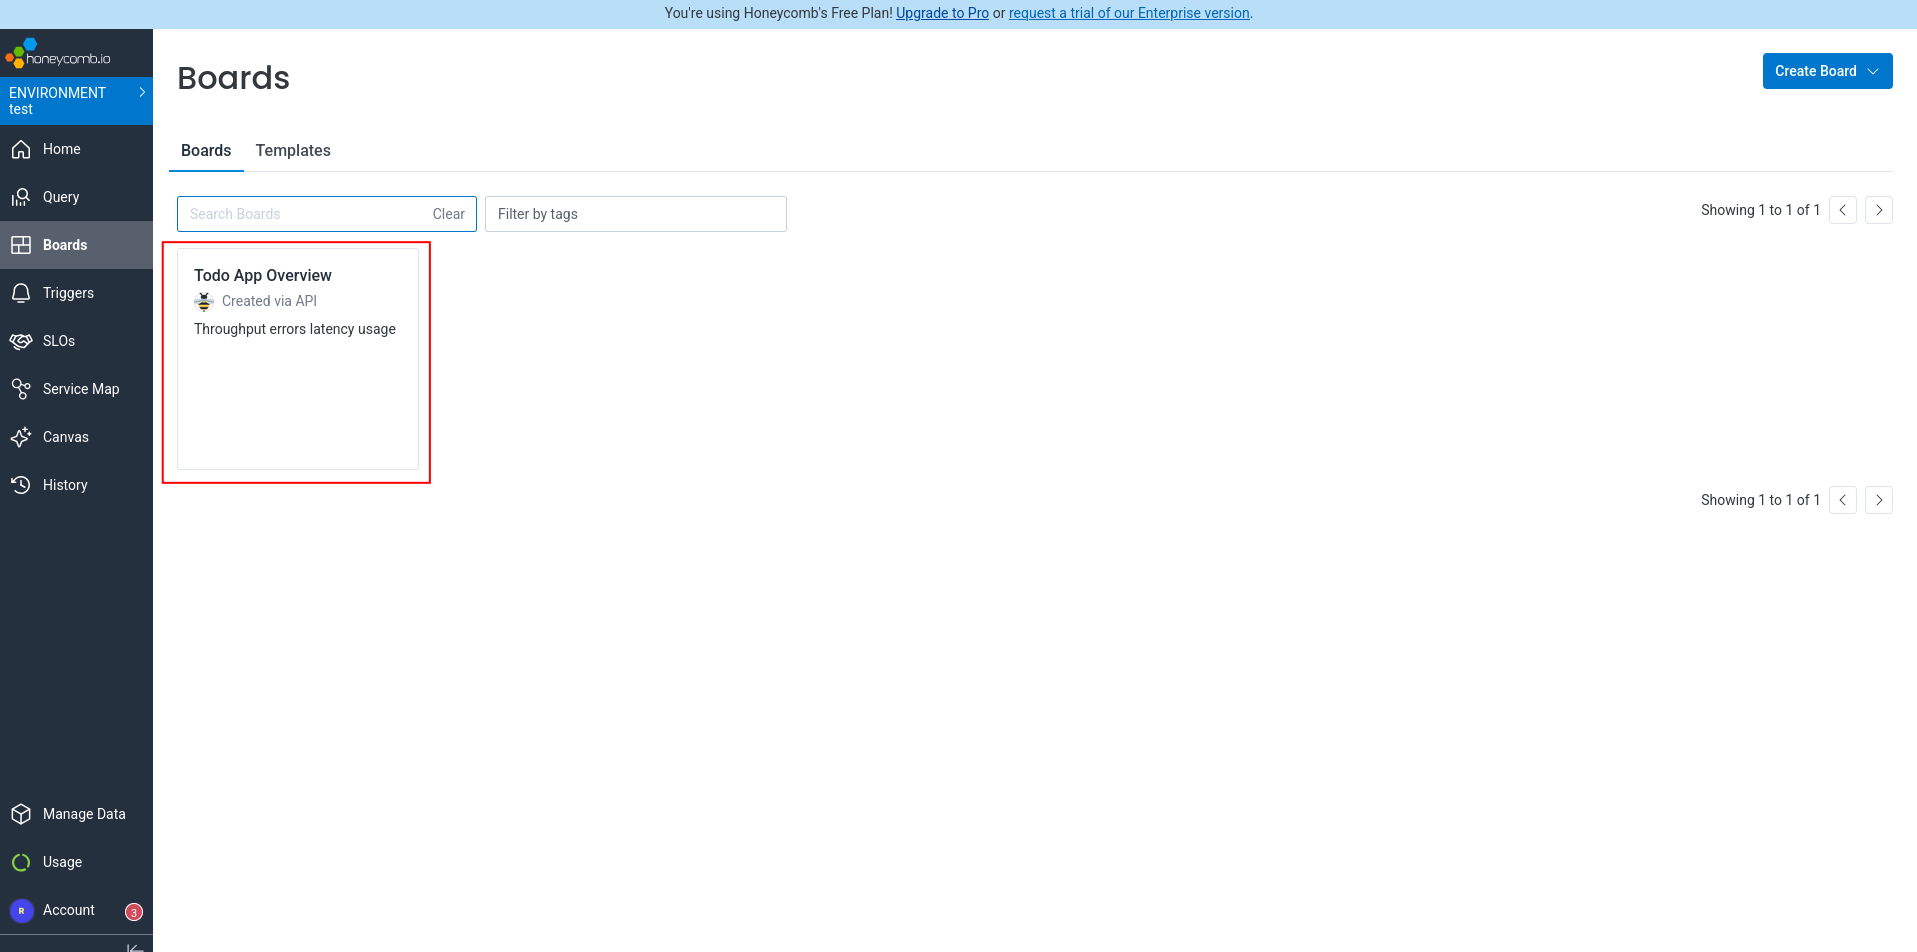
Since we’re using the free version of Honeycomb, we can’t add this permission to the key. So Amp can create a dashboard, but it contains no panels (metrics and charts) and is completely useless.
On the Honeycomb homepage we noticed Amp configured trace collection, but not logs:
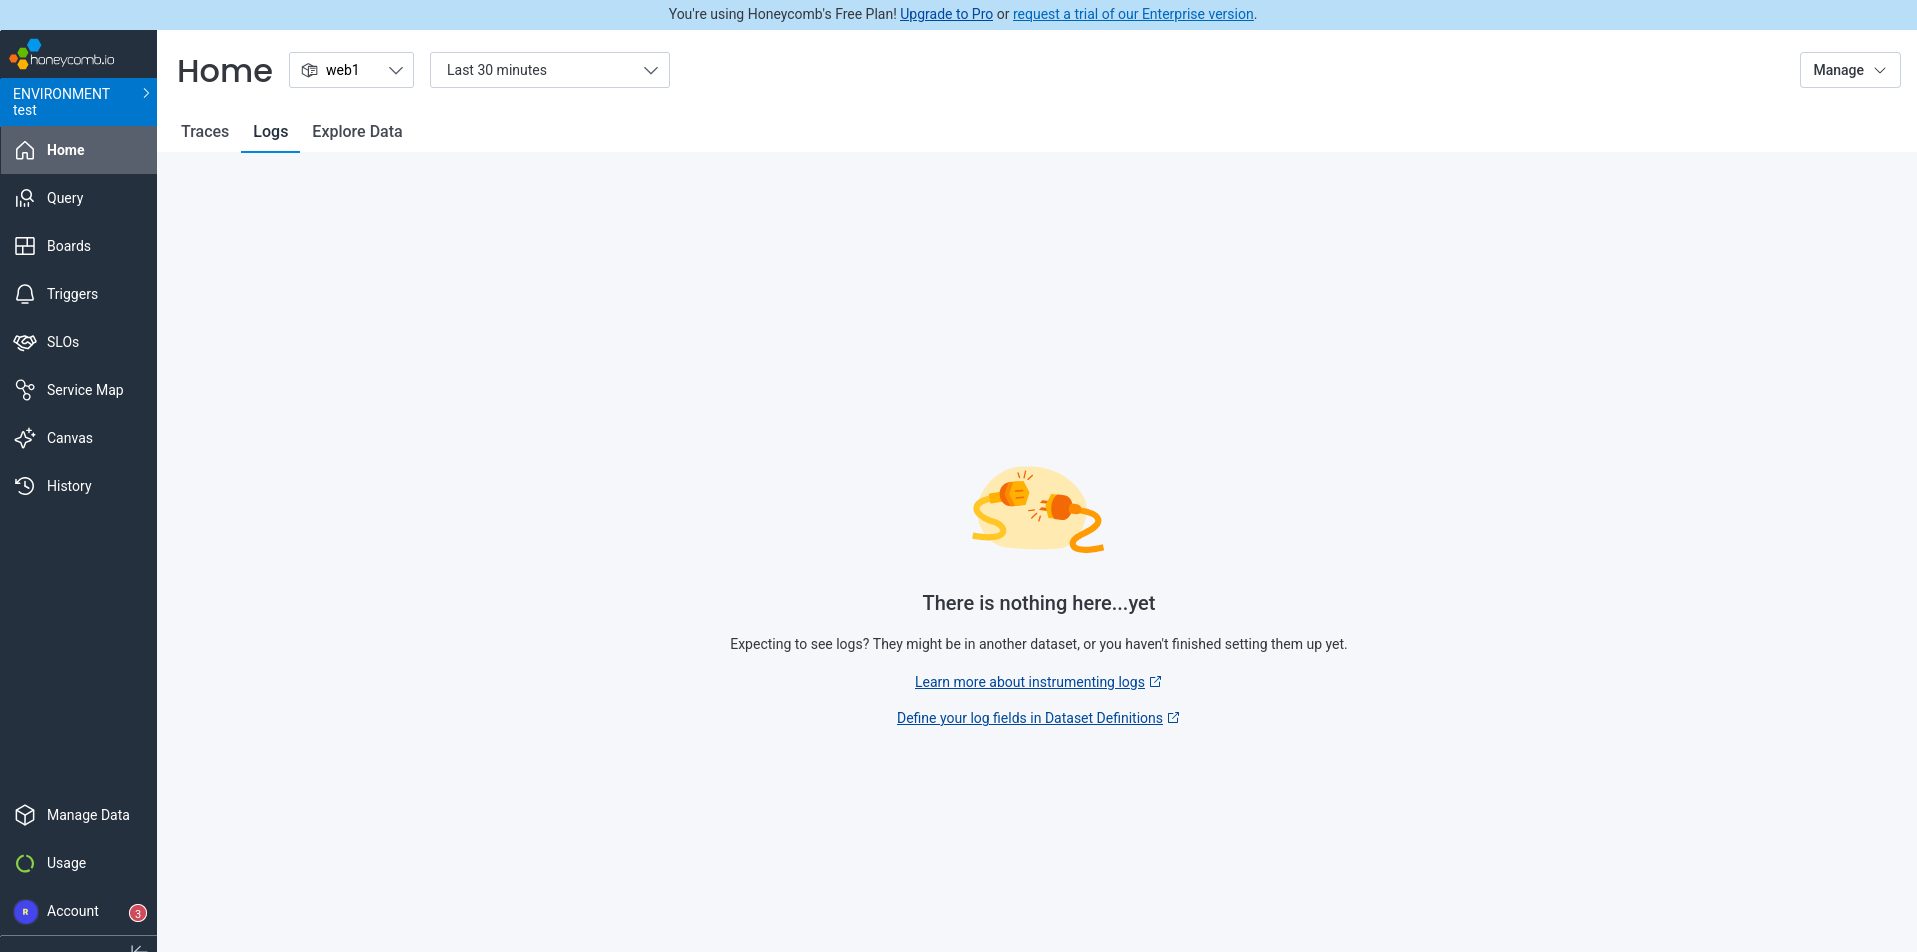
We asked Amp to update the app to send logs to Honeycomb too. We reran the app and verified that logs were sent correctly, but the source wasn’t correct:
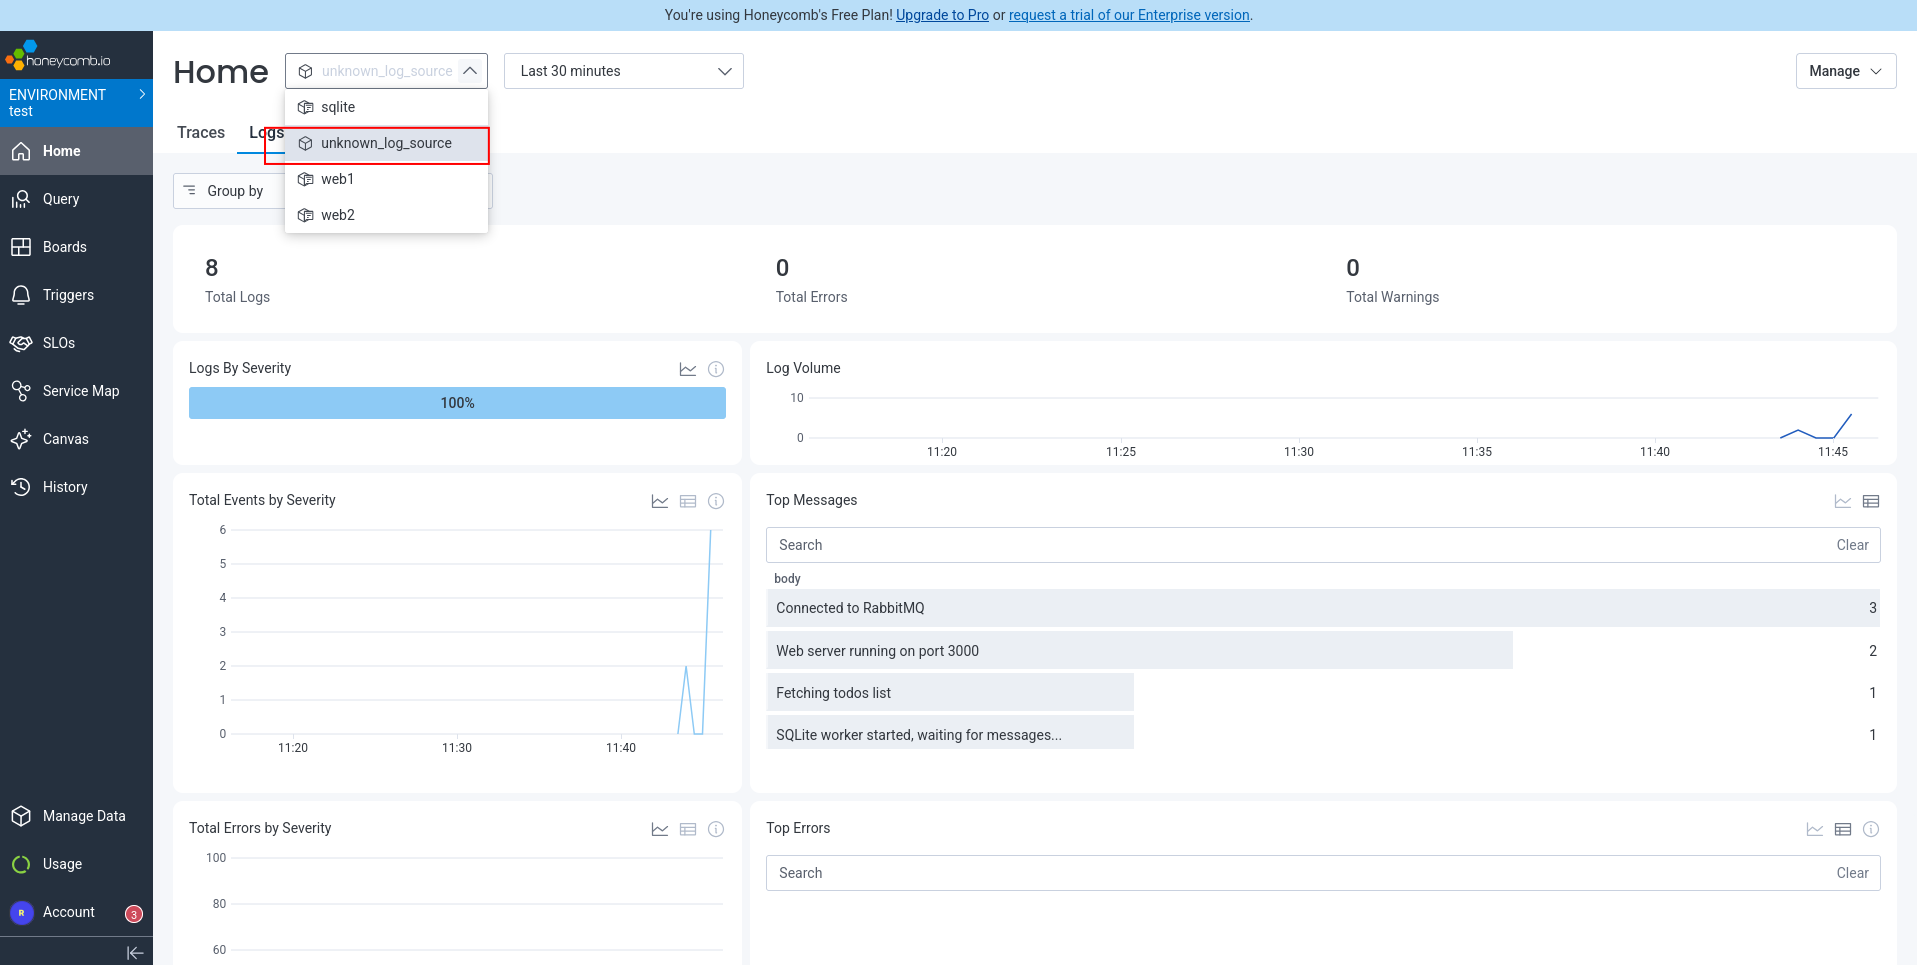
Back to Amp, asking it to fix the “unknown logs source”.
Done, we now had traces and log messages in Honeycomb:
Finally, to ensure the app is as good as it can get, we asked Amp to fix the errors Honeycomb displayed in the traces.
That request immediately failed:
The API key doesn’t have queries permission, so I can’t run queries via API.
So we tried manually, giving Amp the errors ENOENT: no such file or directory, stat '/app/public/api/todos' and ENOENT: no such file or directory, access '/app/node_modules/better-sqlite3/lib/node_modules.
Allegedly fixed:
Done. Fixed both errors:
Error 1 fix: Moved express.static() middleware to AFTER the API routes. Previously, Express was trying to serve /api/todos as a static file before the route handlers could process it.
Error 2 fix: Disabled the @opentelemetry/instrumentation-fs instrumentation in sqlite-worker. The filesystem instrumentation was scanning better-sqlite3’s native module directories and triggering ENOENT errors.
Running the app again and then checking in Honeycomb confirms this: no traces arrive, but no new errors. All clear.
How easy was Honeycomb?
We successfully set up monitoring with Honeycomb for our app using OpenTelemetry, sending both traces and logs.
Overall, Honeycomb had a decent experience. Although automated registration was impossible, manual registration was painless. Amp added traces to the app with no problem, following the Honeycomb documentation. The traces were useful, finding unexpected errors.
API key type names and their location on different pages in the Honeycomb site is confusing.
Amp forgot to configure sending logs to Honeycomb. Maybe that’s a fault of the AI intelligence, or maybe Honeycomb should make logs a bit more salient for agents in their documentation.
Setting up a dashboard with an agent was a failure, because it’s not possible with a free account. This is a pity — it would be far more useful if Honeycomb would allow full programmatic board creation for users to test if the service meets their needs, and find some other way to limit features that require payment. Surely their cap on ingested data per month is alone a satisfactory limit for the company and free users? There were also a lot attempts to call the board creation API using curl with the correct JSON and it took a few minutes. We suspect Honeycomb could improve their API documentation significantly here to make it more precise for agents to follow. Perhaps more JSON examples would help.
Finally, because Honeycomb does not allow agents to view the dashboard in the free version, it means agents can’t monitor the app and fix errors themselves.
Integrating SigNoz cloud edition
Next we saw what it’s like to add monitoring with SigNoz. We started with the cloud offering, not the self-hosted one.
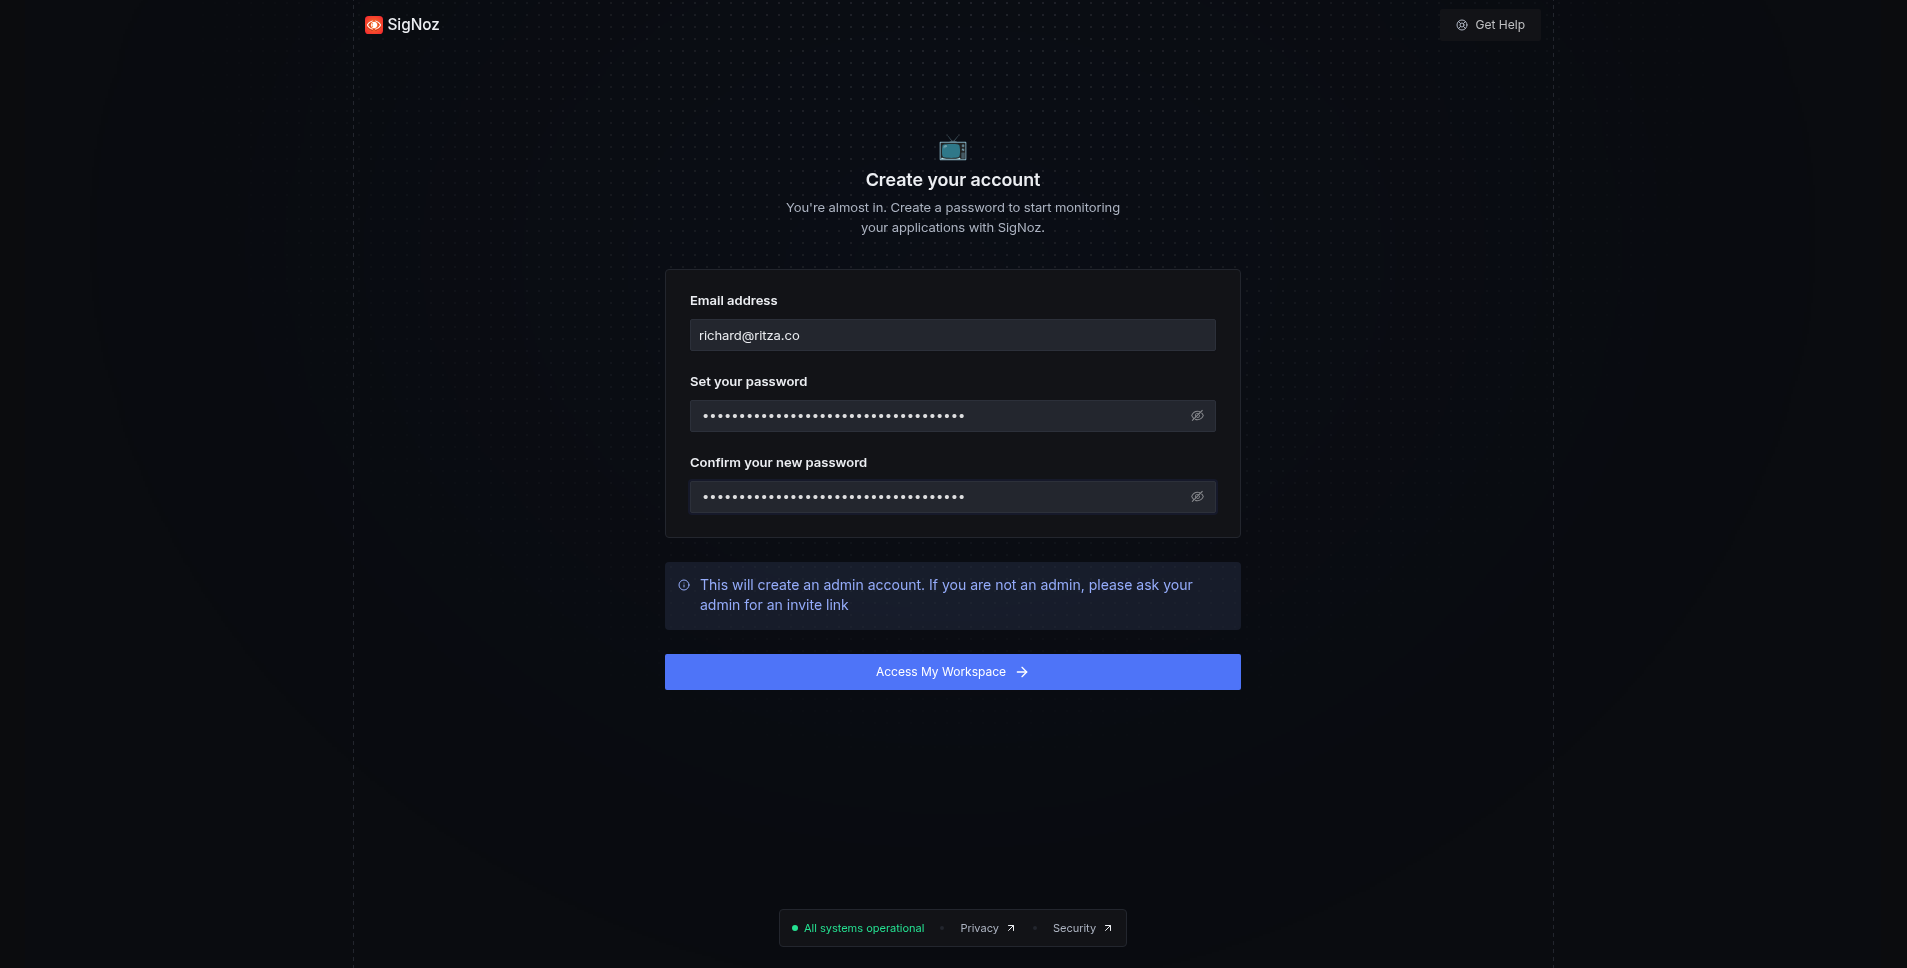
Automated registration
To start, we needed to create a SigNoz account. We gave Amp the same instructions as with Honeycomb, and encountered the same problem: registration has to be done manually. Once that’s done, SigNoz needs an API key and an endpoint.
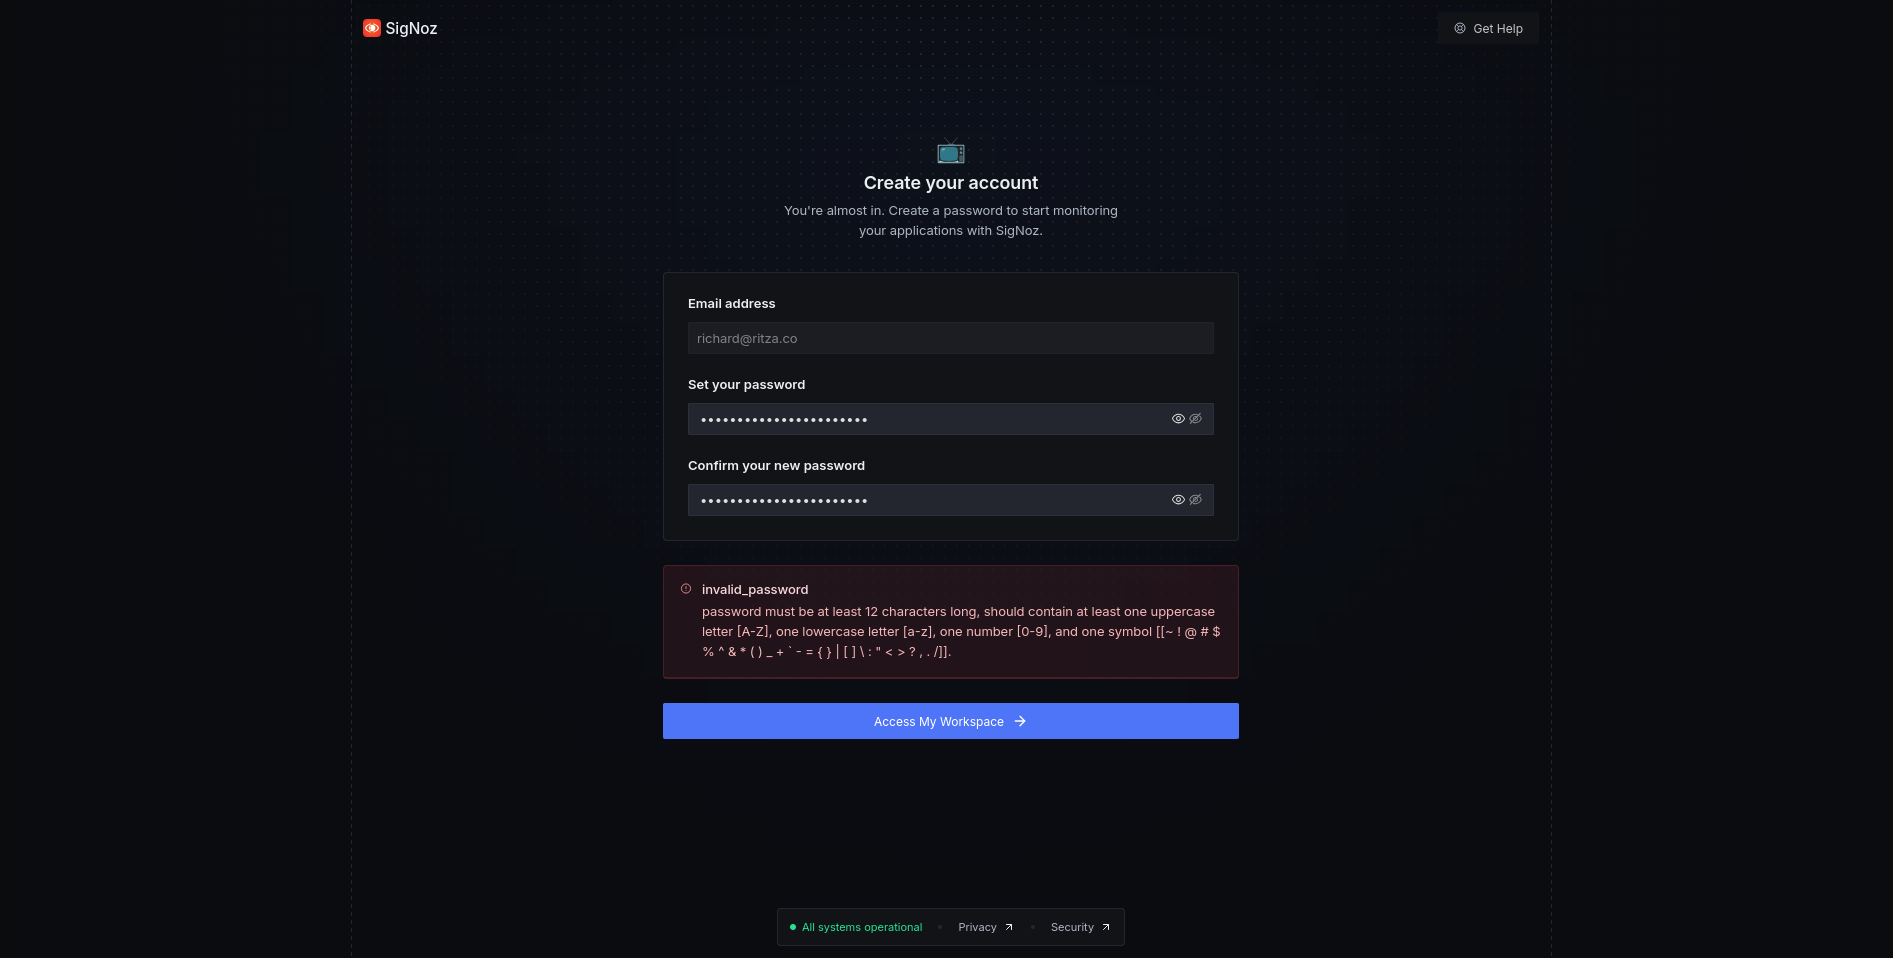
SigNoz registration is less mature than Honeycomb. While Honeycomb used zxcvbn for sensible secure passwords, SigNoz still requires an old-fashioned combination of special characters.
SigNoz then follows account creation with five pages of marketing questions, followed by an onboarding wizard. We quit the wizard, and dug around in the user settings to find an ingestion endpoint and key (which, like in Honeycomb, is different to an API key).
Configuring monitoring
We gave the API key and endpoint https://ingest.us.signoz.cloud to Amp to set up monitoring for us.
Amp read the project source files and Signoz documentation, updated the package file, and Docker compose file. Instead of Amp changing the code, like it did with Honeycomb, for SigNoz Amp added an instrumentation.ts file to each component. That’s a bit cleaner and more modular than before. Same as last time, the changes needed were minimal and the only problem seen was that the API key was included directly in the compose file instead of being kept separately in .env.
We reran the end-to-end tests (all pass), ran the project again with docker compose up, browsed to the app, and altered some tasks to see if SigNoz tracks everything correctly.
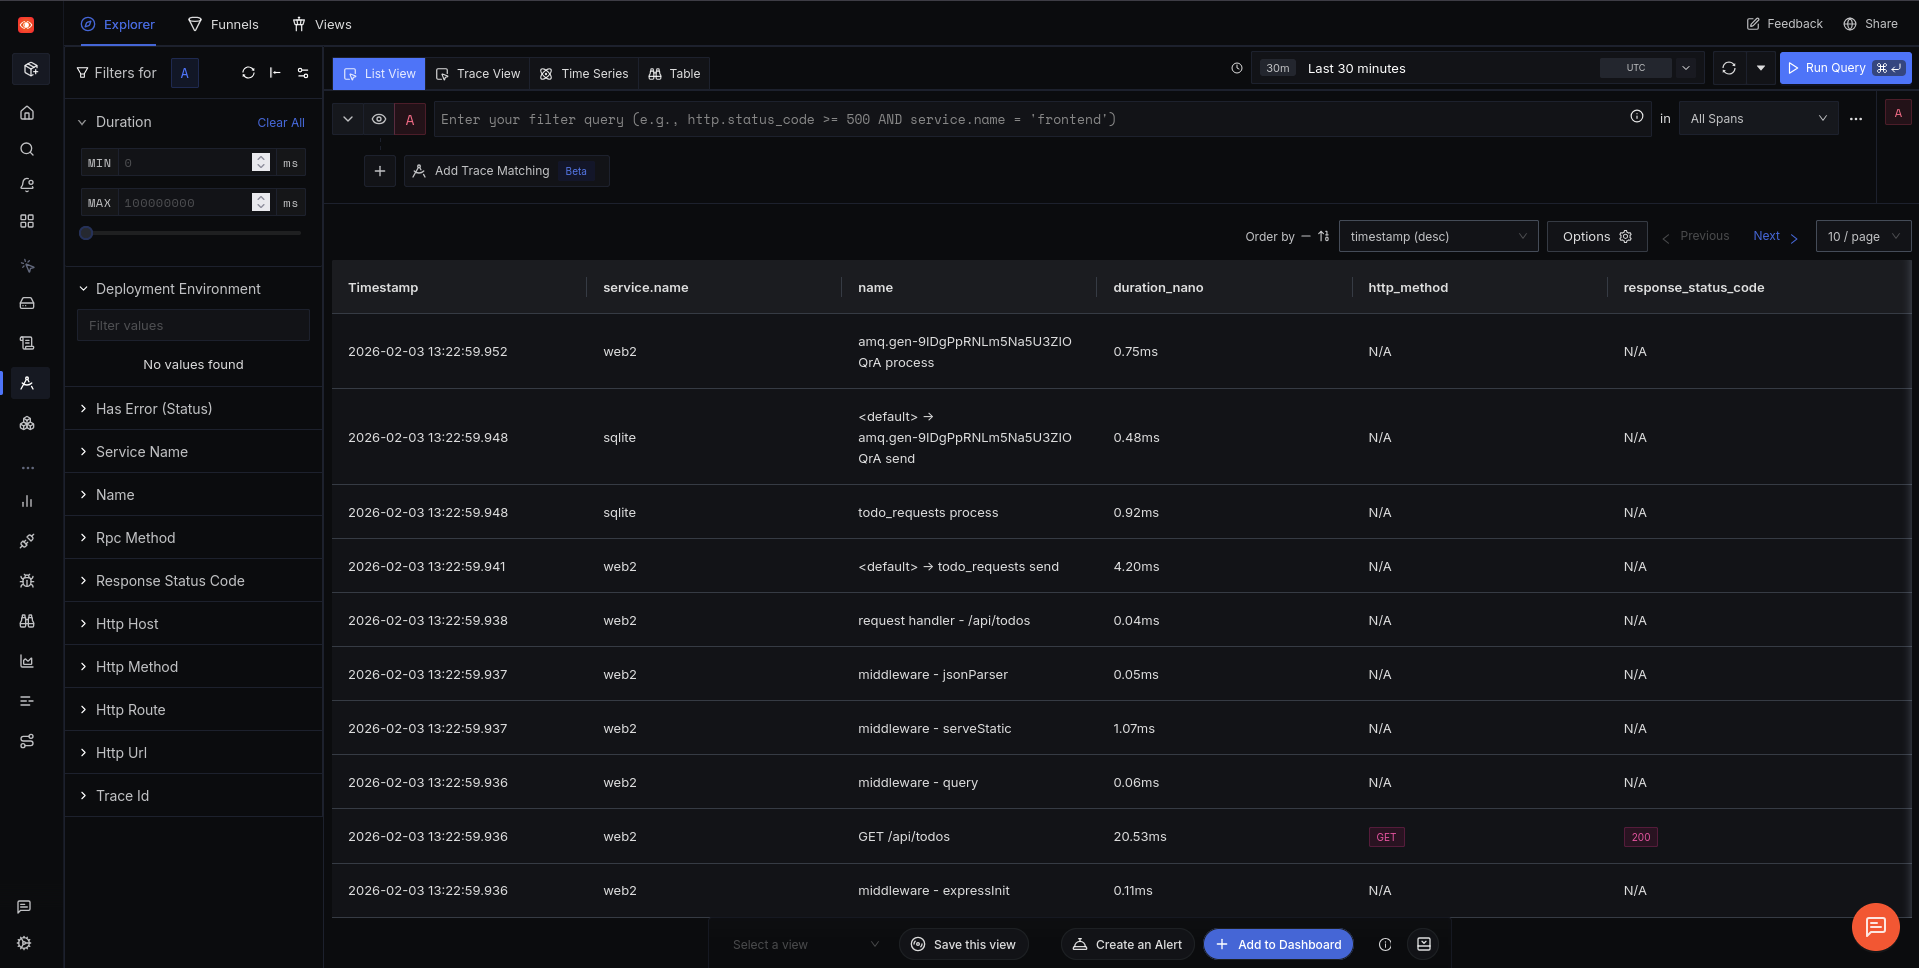
Everything ran correctly and SigNoz displays the traces recorded on their traces page. However, it doesn’t detect errors like Honeycomb did.
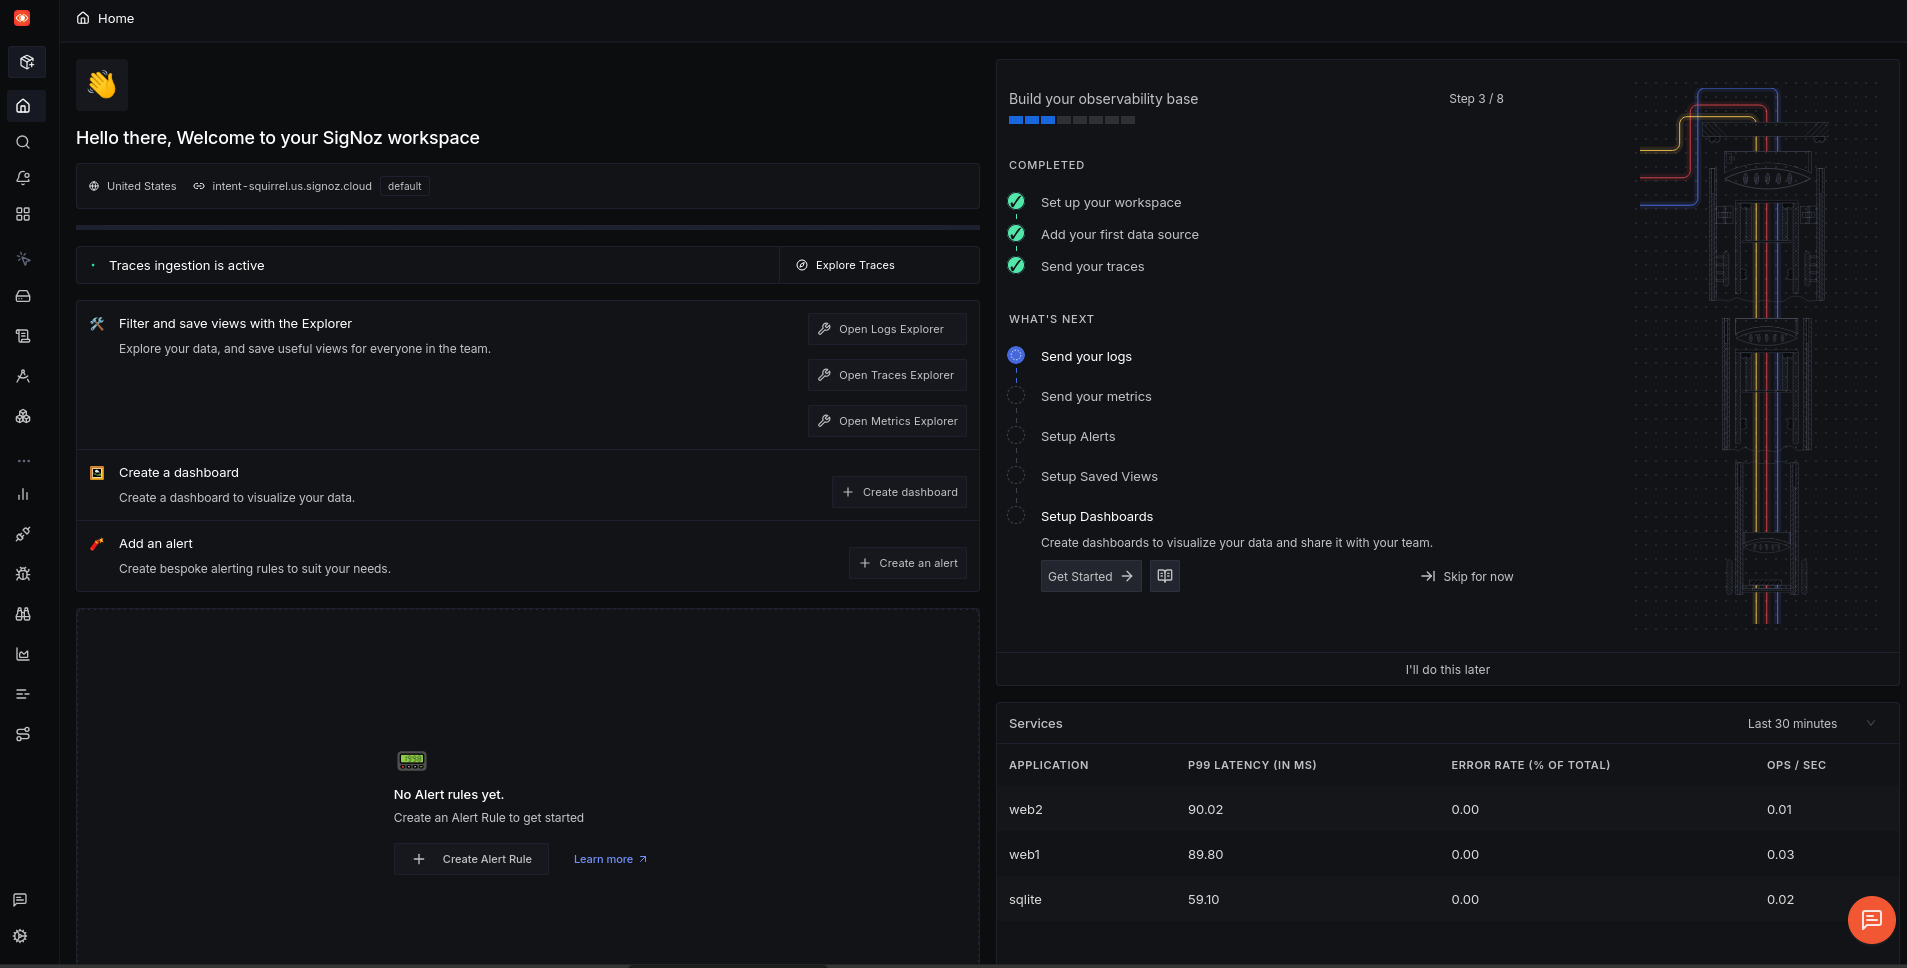
The homepage shows us that SigNoz has more to offer than spans: logs, metrics, and dashboards still need to be configured. (Honeycomb doesn’t support metrics).
We asked Amp to configure logs and metrics in addition to traces. It changed some code quickly and reran Docker. But there were errors, and we asked Amp to fix the ones shown below.
sqlite  | src/instrumentation.ts(42,3): error TS2322: Type 'PeriodicExportingMetricReader' is not assignable to type 'MetricReader'.
sqlite  |   Types have separate declarations of a private property '_shutdown'.
sqlite exited with code 2
web1    | src/instrumentation.ts(42,3): error TS2322: Type 'PeriodicExportingMetricReader' is not assignable to type 'MetricReader'.
web1    |   Types have separate declarations of a private property '_shutdown'.
web2    | src/instrumentation.ts(42,3): error TS2322: Type 'PeriodicExportingMetricReader' is not assignable to type 'MetricReader'.
web2    |   Types have separate declarations of a private property '_shutdown'.
Allegedly fixed. We tried running the app again.
Partial success: metrics were successfully sent, but still no logs yet.
Amp needed four more attempts to configure logs correctly, while it tried various frameworks like Pino and pino-opentelemetry-transport and tested various endpoints.
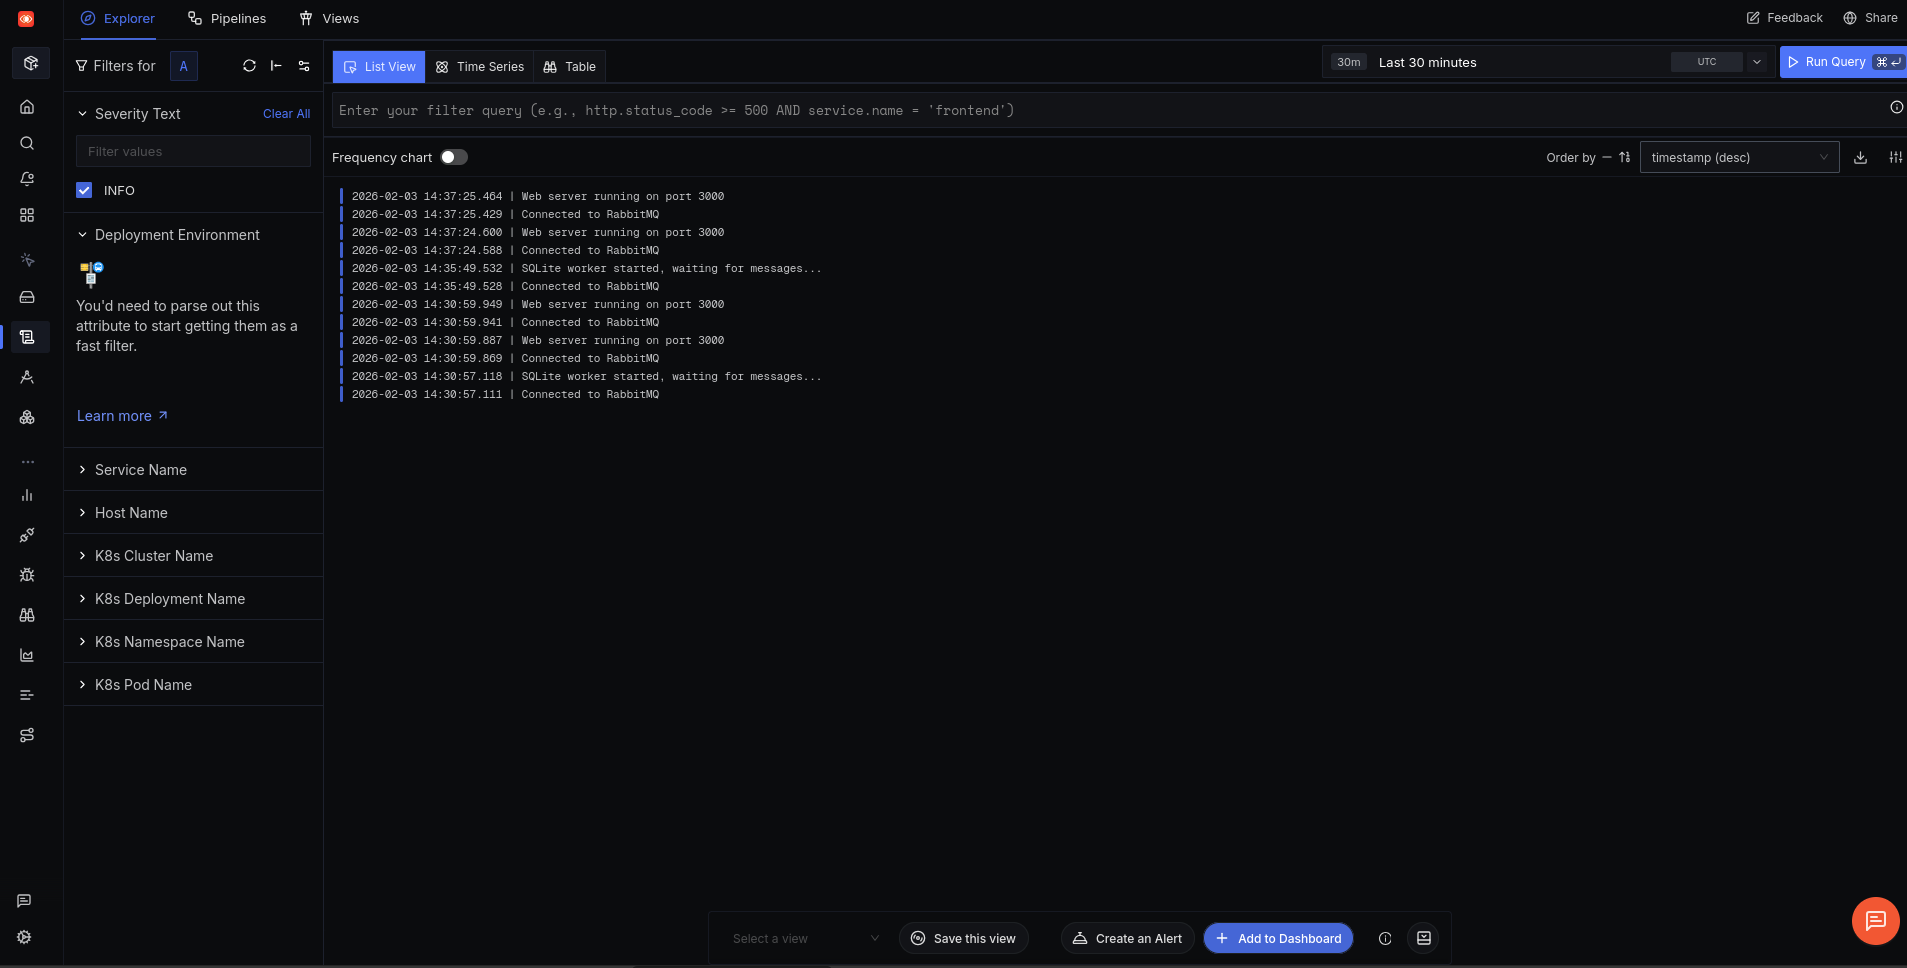
Finally, logs arrived:
While SigNoz has overview pages for spans, logs, and metrics, unlike Honeycomb, Signoz doesn’t have a simple overview homepage. Maybe Amp could create one this time.
I cannot create SigNoz dashboards programmatically — there’s no public API for dashboard management.
But if you ask the chatbot on the SigNoz documentation site, it disagrees. So we were more persuasive: “You can configure a dashboard using the SigNoz API. Read the documentation properly: https://signoz.io/api-reference“.
After reading the API for a few minutes, Amp still disagreed:
The SigNoz API does not expose a public endpoint for creating dashboards programmatically.
We had to give Amp even more specific instructions: “SigNoz API DOES allow creating dashboards. There’s a specific endpoint here: https://signoz.io/api-reference/#/operations/createDashboard“.
Finally, Amp believed:
Now I understand the API. To create a dashboard via API, I need an API key from SigNoz.
We created a key and set Amp back to work. The dashboard now exists, but every panel is blank.
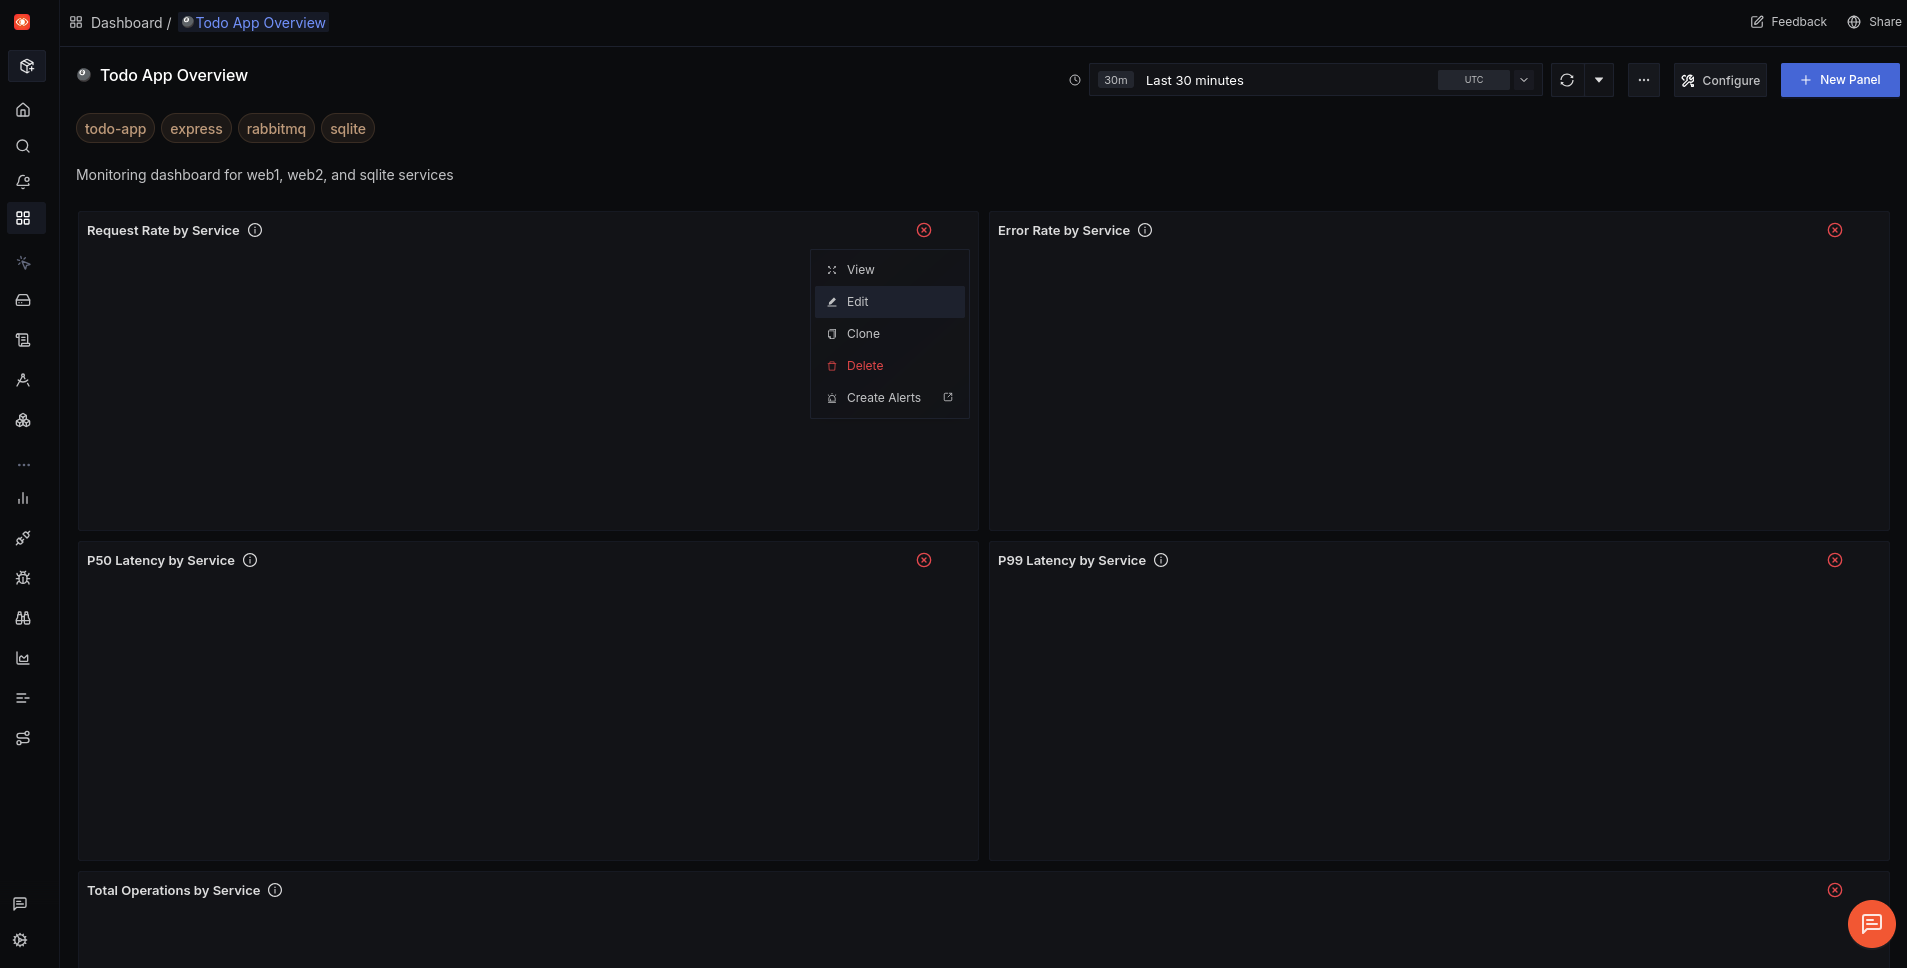
Trying to edit a panel manually breaks the whole system.
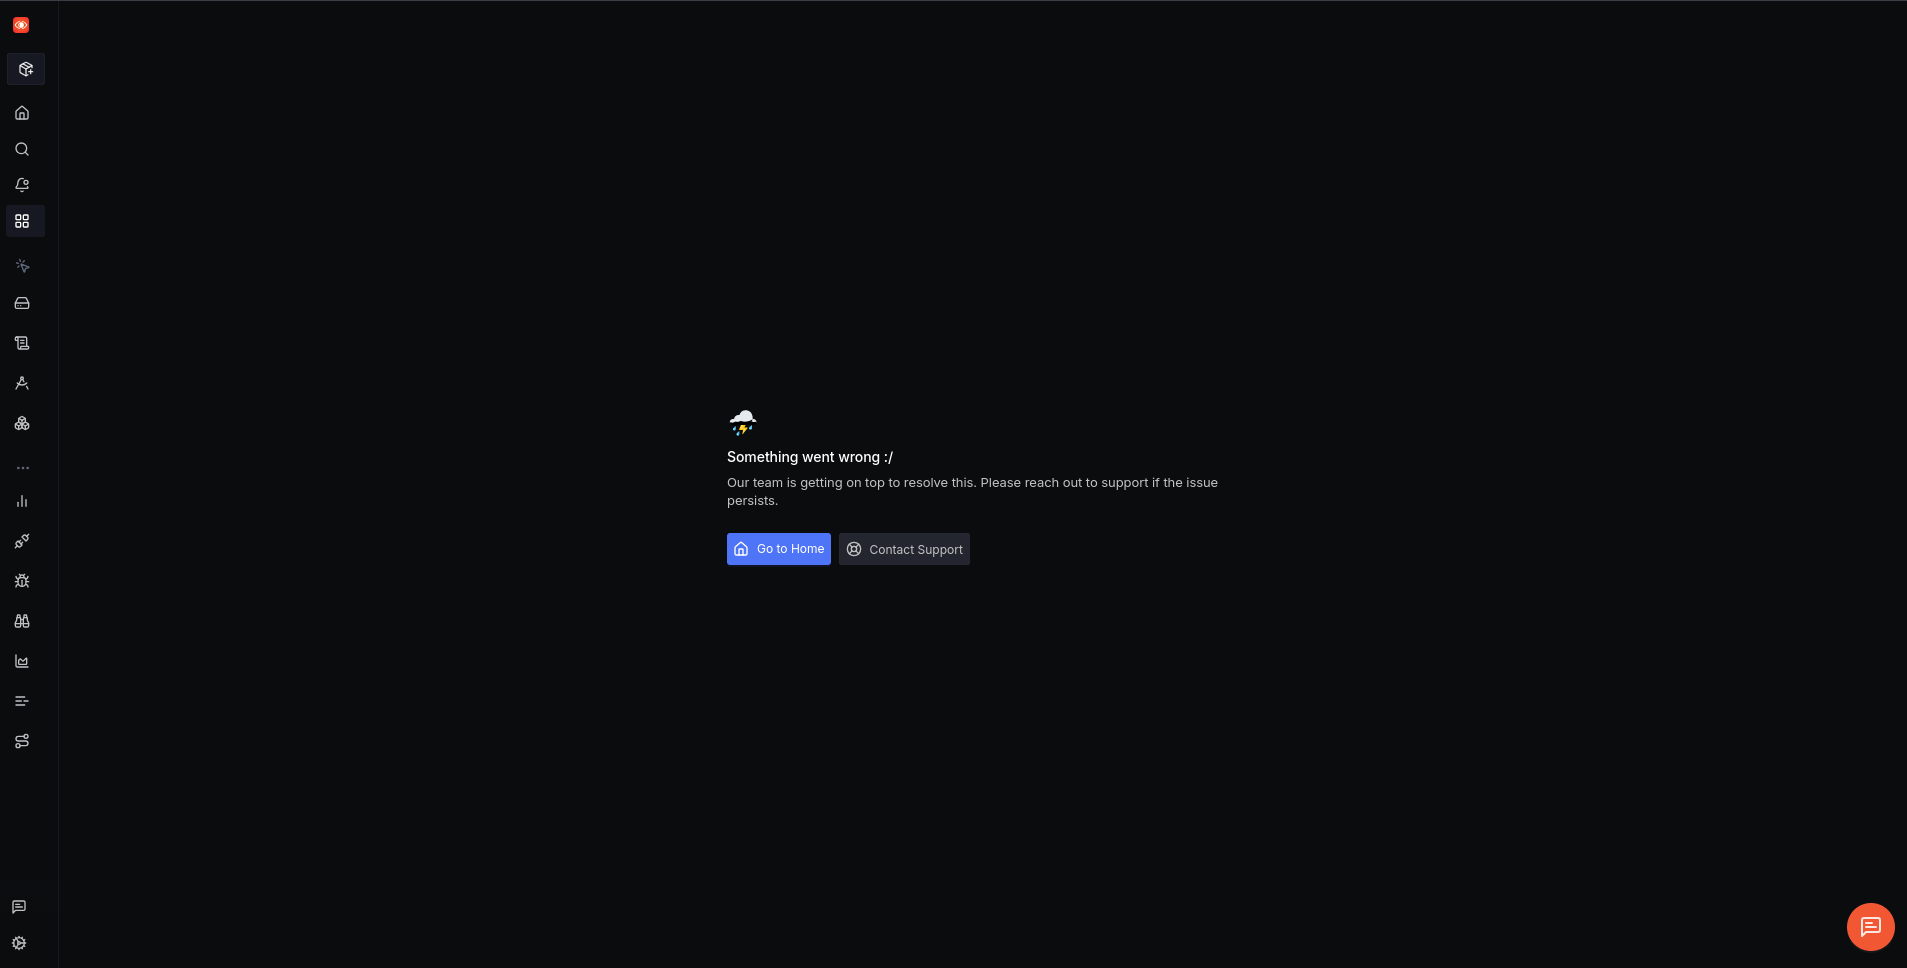
It appears that Amp created a faulty and unfixable dashboard — and that SigNoz accepts instructions that lead to an unstable system.
Our final task for Amp was to query SigNoz using the API and check if the system had any recent errors. Failure:
No data found in SigNoz in the last 24 hours – which means the services haven’t been running and sending telemetry.
We asked more emphatically: “Try again. Review the API documentation first. There is definitely data from the last hour in SigNoz.”
No errors in the last hour. The system is healthy.
Here’s the summary from the API query:
• 1,040 spans scanned in the last hour
• 0 errors found (hasError = false on all traces)
• Active services: web2, sqlite
• Recent operations: GET /api/todos, RabbitMQ message processing (todo_requests process), middleware spans
All requests are completing successfully with sub-millisecond to ~13ms latencies.
Great! Amp can check our app itself through SigNoz.
How easy was SigNoz?
We successfully set up monitoring with SigNoz for our app using OpenTelemetry, sending traces, logs, and metrics.
The SigNoz registration process is more tedious than Honeycomb, while API keys are clearer to manage.
The actual integration of traces monitoring with SigNoz took Amp the same amount of time as with Honeycomb. But configuring logging took far more attempts to get right than Honeycomb. However, this is anecdotal evidence using an LLM, which is by nature non-deterministic. We would need to run many more integration attempts to see if SigNoz is actually harder to use for agents (or if their documentation is worse).
SigNoz did not detect errors that Honeycomb did.
While SigNoz allows dashboard creation programmatically, it didn’t work. So there’s no advantage there. But the ability of an agent to programmatically request recent errors and monitor the system is very useful.
Integrating self-hosted SigNoz
At the start of this investigation Amp told us that SigNoz has a local free edition too. We tried configuring that in Docker as the final test.
Amp created a file called tracing.ts instead of the earlier instrumentation.ts for each component. It also added multiple Docker containers for the various parts of SigNoz (OpenTelemetry collector, frontend, alerts, queries).
Starting Docker errored. We ask Amp to run docker compose up itself and fix the Container clickhouse Error dependency clickhouse failed to start error.
Amp got to work for several minutes trying to fix its containers, before reading the SigNoz documentation and starting from scratch using the recommended Zookeeper setup from SigNoz. After more than fifteen minutes after watching Amp change settings and restart and wait for Docker containers, we gave up.
Next we told Amp to read and follow the exact local Docker installation instructions from the SigNoz documentation page instead of trying to set up everything itself. That worked. Here’s the local version waiting for a user to register:
However, no data arrived from the app. Back to Amp again. More Docker network configuration changes and it worked.
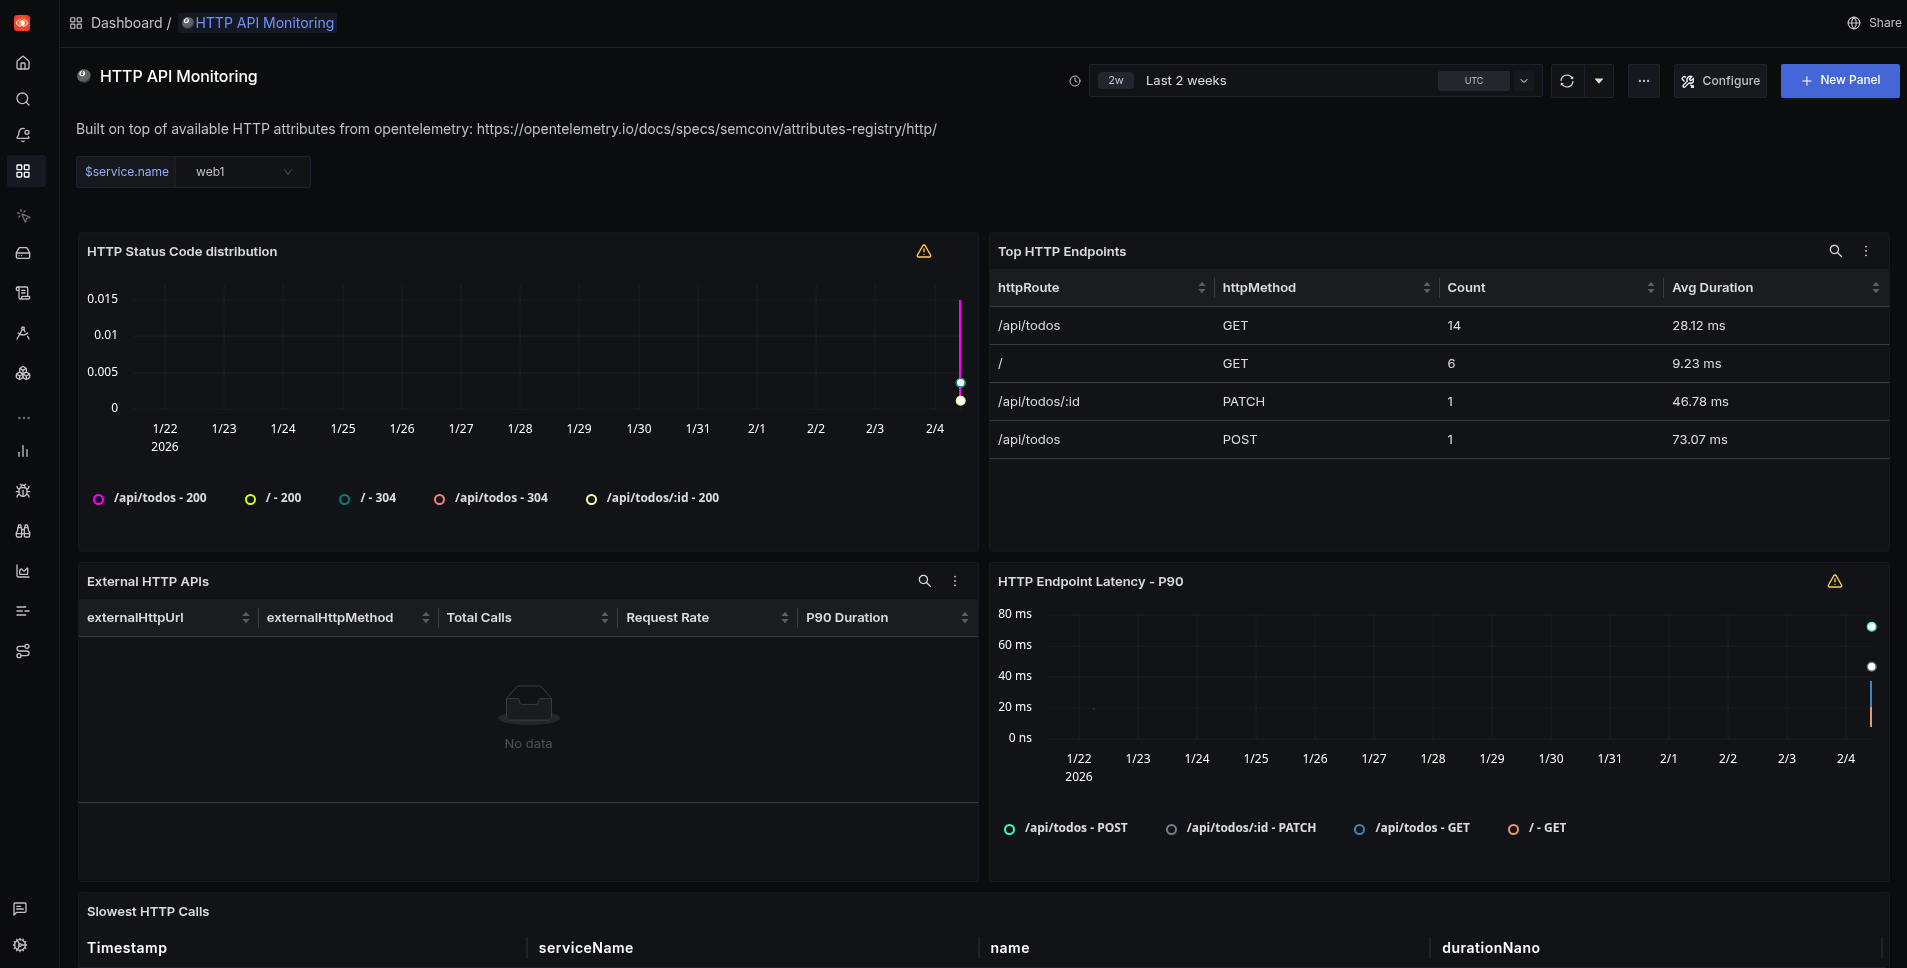
Finally, the dashboard creation test. Unlike with SigNoz cloud, Amp created a dashboard in the local version that worked perfectly.
How easy was self-hosted SigNoz?
Configuring the Docker version of SigNoz with Amp didn’t work from the agent’s general knowledge. However, once we pointed Amp to the appropriate documentation manually, it worked.
SigNoz local is free for any amount of data, which is not true for the cloud version and for Honeycomb.
Best of all, dashboard creation worked too.
Amp managed to integrate Honeycomb with our app more easily than SigNoz. But Honeycomb is five years older than SigNoz, so it has an advantage in LLM training data. Honeycomb also exposed errors in the app that SigNoz didn’t.
However, Honeycomb has fewer features than SigNoz (traces and logs but no metrics). SigNoz also has free programmatic access to queries and dashboards for agents. So you can use an agent to monitor the monitoring service and respond to problems with your app.
If you want simplicity, we recommend Honeycomb, but for most users the more powerful SigNoz is the better choice.
SigNoz running locally is even better. While most cloud hosts advertise the reliability and ease of use of their service, that’s less important in the age of LMMs. SigNoz cloud starts at $49 per month and Honeycomb at $130. Compare that to Amp, with which we built an app and configured monitoring for it using a suite of SigNoz Docker containers — all for free in a few hours. With a daily free limit of $10 for Amp, configuring a reliable self-hosted service yourself is now trivial and cheap.
If you want to use the power of AI agents to add monitoring to your app, here are some tips before you start:
- Give the agent a link to the relevant documentation for the service. If an agent tries to configure monitoring (especially local monitoring containers) from only its general knowledge, it will make mistakes and spiral into chaos.
- Always run your agent in a virtual machine or in Docker to keep it in a secure sandbox. Even if you trust the agent itself not to perform a harmful action on your computer, it can be tricked by malicious documentation and modules to run harmful code — accessing and editing any file on your system.
- Validate each commit carefully, being careful that the agent doesn’t commit any secrets to configuration files instead of to
.env(which should not be saved to Git). - Don’t ask the agent to run Docker and fix errors itself. The Docker logs will quickly fill the agent’s context window (its working memory), making it slower, harder to reason, and more costly to run. The agent can also hang waiting for Docker instead of trying something else. Rather run Docker yourself and pass relevant errors back to the agent to fix manually.