Study participants
A total of 18 individuals were enrolled in the study—11 with relapsing-remitting MS, two with clinically isolated syndrome (CIS), two with other neuro-inflammatory disorders (OND) and three healthy controls (HCs). The demographics of the four cohorts are presented in Table 1 and those of each individual in Supplementary Table 1. All of the patients in the MS and CIS (MS/CIS) cohort were treatment-naive (that is, no previous history of immunomodulatory or immunosuppressive therapies) at the time of sample collection but one of the patients with OND was on immunotherapy with a TNF-α inhibitor.
Identification of T cell subsets by single-cell sequencing
Paired peripheral blood and CSF were collected on the same day for each study participant. Freshly acquired samples comprised of all unseparated cell subsets underwent paired scRNA-seq and scTCR-seq using 10X Genomics 5′ library preparation kits to permit combined single-cell transcriptional phenotyping and TCR clonal analysis. The scRNA-seq data of all participants in this study were previously published15. All major immune cell subsets were readily identified from the scRNA-seq data, with T cell clusters comprising the largest fractions (Fig. 1a). To characterize conventional TCRαβ T cells, all subsequent analyses focused on only those T cells with paired scRNA-seq and scTCR-seq data (Fig. 1b). A total of 48,468 individual T cells were identified from the blood and CSF across all participants (Fig. 1c). As expected, TCR-associated genes (CD3E and CD3D) were highly upregulated with minimal expression of non-T cell-associated genes (for example, CD19; Extended Data Fig. 1). We identified 33,349 CD4+ and 15,119 CD8+ T cells expressing paired TCRαβ genes (described in Methods) for analysis from the combination of blood and CSF of all 18 participants (Supplementary Table 2).

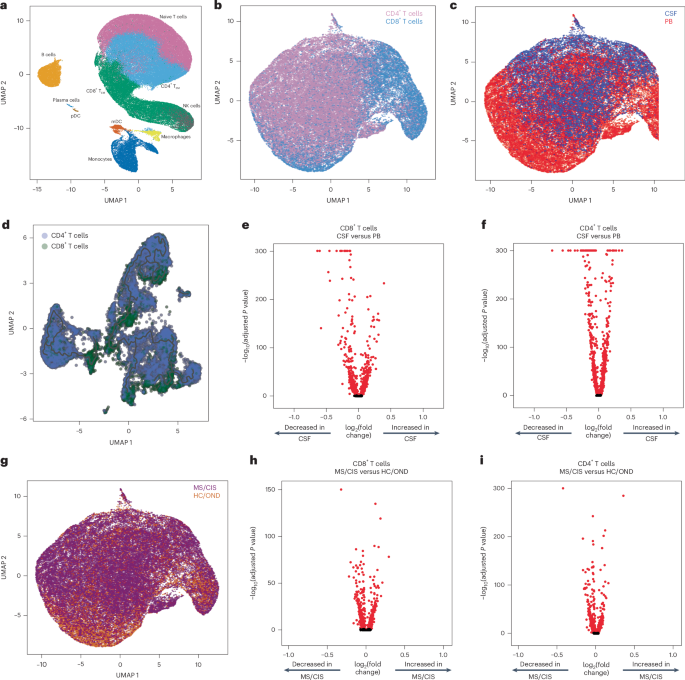
a, Major immune cell subsets from combined blood and CSF of all patients were identified by scRNA-seq. mDC, myeloid dendritic cells; NK, natural killer cells; pDC, plasmacytoid dendritic cells; TEM, effector memory cells. b,c,g, T cells were defined after integration of the scRNA-seq and scTCR-seq data, allowing segregation of T cells by CD4/CD8 status (b), compartment (CSF; c) and disease status (g). d, Pseudotime trajectory analysis of CD4+ and CD8+ T cells in CSF and peripheral blood (PB). e,f,h, Analysis of differential gene expression between CSF-derived and PB-derived CD8+ (e) and CD4+ (f) T cells as well as between MS/CIS-derived and HC/OND-derived CD8+ (h) and CD4+ (i) T cells. Differential gene expression comparisons were performed using a two-sided Wilcoxon ranked-sum test with Bonferroni correction (adjusted P). Genes with adjusted P
Pseudotime analysis of T cells in the CSF revealed distinct populations of T cells largely segregated based on T cell subsets (that is, CD4+ or CD8+), highlighting the distinct transcriptional signatures associated with different T cell states and functions (Fig. 1d). Both CD8+ and CD4+ T cells were distinct between the peripheral blood and CSF (Fig. 1e,f). For instance, CD8+ T cells (Supplementary Table 3) in the CSF displayed significantly increased expression of various genes relative to the peripheral blood, including genes associated with migration and trafficking (CXCR3, CXCR4, CCL4, ITGB1 and ITGA4), signaling and activation (CD2, FYN and DUSP2), and cytotoxicity (GZMK and GZMA). In contrast, peripheral blood-derived CD8+ T cells expressed significantly higher levels of FOS, JUN, DUSP1 and GADD45B, indicating an alternate activation state. In a comparison of only memory (CD27-expressing) CD8+ T cells, there was significant upregulation of genes associated with T cell activation (HLA-DRA), chemokines (CCL4 and XCL1) and cholesterol metabolism (LDLR and SQLE), and downregulation of genes associated with T cell signaling (FOS, FOSB, JUN and JUNB) in the CSF relative to the blood (Extended Data Fig. 2a and Supplementary Table 4). In the CSF, CD4+ T cells (Supplementary Table 3) had significantly increased expression of genes similar to their CD8+ T cell counterparts (ITGB1, ITGA4, CXCR3, GZMA, GZMK and CD2) as well as distinct genes (JUN, FOS, DUSP1, CCR7 and HCST).
Given the disproportionate number of participants in the different disease categories (Table 1), we grouped the patients with MS or CIS (MS/CIS; n = 13) and performed differential gene expression against the combined group of HCs and patients with OND (HC/OND; non-MS group; n = 5; Fig. 1g). In CD8+ T cells combined from the peripheral blood and CSF, various genes were differentially expressed between the MS/CIS and HC/OND groups (Fig. 1h). In particular, genes associated with tissue trafficking (CXCR4, CCL5, KLF2, ITGA4, ITGB1 and CD69) and cytotoxicity (GZMK, KLRG1 and GZMA) were upregulated in the MS/CIS cohort (Supplementary Table 5). In contrast, genes associated with central memory status (CCR7, SELL and LEF1) and TCR signaling (CD8B, CD3D, CD3E, LCK, ZAP70 and LAT) were downregulated relative to the HC/OND group. A similar profile was observed for CD4+ T cells from the blood and CSF of patients with MS/CIS, including increased expression of genes related to tissue migration (ITGB1, CD69, ITGA4, CXCR3 and CXCR4) and cytokine secretion (IL32 and GZMK), and reduced central memory status (CCR7, LEF1, SELL and TCF7) and TCR signaling (LCK; Fig. 1i and Supplementary Table 5). Overall, these data suggest that both CD8+ and CD4+ T cells in the patients with MS/CIS are more activated with increased effector functions and tissue homing capacity than the HC/OND cohort, consistent with other studies11,12.
T cell clonal analysis
The clonal repertoire of T cell subsets was compared across compartments (that is, peripheral blood versus CSF) and across disease states (that is, MS/CIS versus HC/OND). T cell clonotypes were defined as T cells sharing identical V and J genes and CDR3 amino-acid sequences for paired TCRαβ sequences similar to previous studies10,16. A total of 31,756 unique CD4+ T cell clonotypes and 10,825 unique CD8+ T cell clonotypes were identified from all individuals (Supplementary Table 2). The CD4+ and CD8+ T cell diversities (measured by Shannon entropy) were significantly higher in MS/CIS compared with HC/OND in the peripheral blood and CSF (Extended Data Fig. 3). The diversity of CD4+ T cells was significantly higher in blood compared with CSF but not for CD8+ T cells (Extended Data Fig. 3). These findings suggest a more diverse array of CD4+ and CD8+ T cell clonotypes are present in both the blood and CSF of patients with MS/CIS.
T cell clonal expansion is a hallmark of previous antigen encounter; therefore, our analysis focused on T cell clonality in the CSF. T cells were divided into three different categories of clonal expansion: unexpanded (single cell of a given clonotype), moderately expanded (>1 cell but 10,17. Although small fractions of clonally expanded CD4+ T cells were observed in the CSF, much larger populations of highly and moderately expanded CD8+ T cells were observed in similar proportions in the MS/CIS and HC/OND groups (Fig. 2a). CD4+ and CD8+ T cell clonal expansion in the CSF was overall similar between the patients with CIS or MS (Supplementary Table 6).

a, CD8+ and CD4+ T cell clonal expansion was compared between MS/CIS and HC/OND subjects. b, Clonal frequencies of all T cell clonotypes in the CSF and blood that were highly expanded T cells and enriched at least twofold more frequently than the blood of the same individual are highlighted in red. c,d, Frequency of highly expanded and enriched T cells according to CD8 (n = 24) or CD4 (n = 10) status (c) and MS/CIS (n = 25) or HC/OND (n = 9) status (d). Data are the mean ± s.e.m.; unpaired two-tailed Student’s t-test with Welch’s correction; NS, not significant. e, Analysis of differential gene expression between highly expanded and unexpanded T cells in the CSF. Two-sided Wilcon ranked-sum test with Bonferroni correction; genes with adjusted P f,g, Unbiased clustering of all CSF T cells (f; the 11 distinct clusters are numbered) overlaid with highly expanded/enriched T cells (g).
Cerebrospinal fluid enrichment of highly expanded T cell clonotypes
To delineate between T cells expanded similarly in the blood and CSF versus those preferentially expanded in the CSF, the abundance of all T cell clonotypes in the blood and CSF was compared in all individuals. The overwhelming majority of T cell clonotypes were detected in the blood or CSF only, whereas only about 1.5% of all clonotypes were found in both compartments (Fig. 2b). We postulated that highly expanded T cell clonotypes (that is, CSF frequency of ≥0.75%) that were enriched in the CSF relative to the peripheral blood were more likely to be responsive to local antigens in the CSF and/or CNS (albeit not necessarily CNS-specific antigens). Enriched CSF-expanded T cell clonotypes were defined as those with a CSF frequency at least twofold higher than the peripheral-blood frequency from the same individual. This yielded 33 highly CSF-enriched and expanded T cell clonotype varying from approximately twofold to more than 100-fold higher frequencies in the CSF relative to peripheral blood (Fig. 2b and Supplementary Table 7). More than 70% of the highly expanded and CSF-enriched T cell clonotypes in the CSF were CD8+ T cells. The frequencies of highly expanded CSF-enriched CD8+ and CD4+ T cells were similar, ranging from 0.76 to 4.9% of the entire CSF repertoire of an individual (Fig. 2c). Although there were no statistically significant differences in the mean frequencies of highly expanded CSF-enriched T cell clonotypes between MS/CIS and HC/OND, only participants in the MS/CIS cohort had CSF-enriched T cells with frequencies greater than 2% (Fig. 2d). One patient with MS (patient identifier (ID), MS6) had 11 highly enriched T cell clonotypes, the majority of which were CD8+ T cells, which encompassed nearly 20% of their CSF repertoire (Supplementary Table 7). These findings therefore provide strong support for robust oligoclonal CD8+ T cell expansion and enrichment in the CSF, with the greatest expansion found in MS/CIS.
Single-cell transcriptomics of cerebrospinal fluid-expanded T cells
Highly expanded and unexpanded T cells in the CSF were compared by scRNA-seq analysis. Substantial differential gene expression changes were observed in highly expanded T cells in comparison to their unexpanded counterparts (Fig. 2e and Supplementary Table 8). In particular, genes associated with cytotoxic CD8+ T cell function (CD8A, CD8B, NKG7, KLRD1, GZMA, GZMH, GZMM, GZMK and EOMES) and chemotaxis (CCL5 and CCL4) were significantly increased in highly expanded T cells, whereas genes associated with naive status were significantly reduced (IL7R, LTB and LDHB). Targeted gene expression analysis revealed increased expression of additional genes associated with effector/memory differentiation (KLRG1 and CD27), tissue homing (CXCR3 and CCR5) and resident memory status (CD69 and IGTAE) as well as inhibitory genes associated with chronic antigen exposure (HOPX, TIGIT, DUSP2, PDCD1 and LAG3) in highly CSF-expanded CD8+ and CD4+ T cells (Extended Data Fig. 4). A tissue-resident-memory (TRM) phenotype of CSF-expanded T cells coexpressing CD69 and IGTAE was confirmed by the reduced expression of KLF2 and S1PR1 genes (Extended Data Fig. 2b,c and Supplementary Table 9). In contrast, CSF-unexpanded T cells expressed higher levels of genes associated with central memory/nonactivation (SELL, CCR7, IL7R, TCF7 and LEF1) as well as the integrin gene ITGB1. To further characterize CSF-enriched and expanded T cell clonotypes, the 33 T cell clonotypes were overlaid with 11 distinct CSF T cell clusters (Fig. 2f,g). The overwhelming majority of the enriched and expanded clonotypes were found in cluster 1, which was defined by a significantly increased expression of a number of genes associated with cytotoxic effector CD8+ T cells, including CD8A, CD8B, PLEK, DUSP2, EOMES, GZMK, GZMA, GZMH, PRF1, NKG7, CCL5 and CCL4 (Supplementary Table 10). Overall, these data indicate that highly clonally expanded T cells in the CSF express gene profiles indicative of substantial antigen experience, cytotoxicity and distinct tissue homing capacities.
Clonal relationships of expanded cerebrospinal fluid-enriched T cells
Nearly all CSF T cell clonotypes across all individuals were unique. Only 21 identical TCRs (that is, same V and J genes and CDR3 amino-acid sequences for the paired α and β chains) were found between the peripheral blood of different individuals and another three that were identical between the blood and CSF of different individuals, irrespective of disease status (Fig. 3a). To further assess clonal relationships, Grouping of Lymphocyte Interactions with Paratope Hotspots 2 (GLIPH2) was employed, an algorithm to help identify TCRs with potentially shared specificity based on sequence similarity within the CDR3β region18. All CSF T cell clonotypes were analyzed using GLIPH2 and the output was then queried against the 33 CSF high-enriched CDR3 sequences. Using this approach, 19 clonally related networks comprised of a total of 44 clonotypes were identified (Fig. 3b and Supplementary Table 11). Most of the networks comprised two related clonotypes and two networks were comprised of five clonotypes each. Almost all networks consisted of clonotypes from the same individual and were identified primarily among the individuals with MS or CIS (Fig. 3b). Nearly all of the clonally related T cells were CD8+ T cells (Supplementary Table 11), suggesting potential shared antigen specificity.

a, Number of unique or shared T cell clonotypes between different compartments from all study participants. PB, peripheral blood. b, GLIPH2 analysis of highly expanded and enriched T cell clonotypes in the CSF compared with all other CSF T cell clonotypes. Clonal size is indicated by node size and clonally related populations are connected by lines. The number in each clonotype refers to the participant ID. c, The indicated GLIPH2-aligned CD8+ TCRs to the EBV-specific TCRs 86333_1456 (left) and 69317_24418 (right) were expressed in reporter Jurkat cells and tested for reactivity to the corresponding EBV peptides (n = 3) or no-stimulation control (n = 3). Data are the mean ± s.e.m. FLRGRAYGL (EBV EBNA3A193–201) was presented by HLA-B*08:01-expressing APCs (left) and EPLPQGQLTAY (EBV BZLF154–64) was presented by HLA-B*35:01-expressing APCs (right).
Antigen discovery of highly expanded cerebrospinal fluid-enriched CD8+ T cells
Antigen discovery efforts focused on the 23 highly expanded, CSF-enriched CD8+ T cell clonotypes (≥0.75 of the CSF repertoire and enriched at least twofold in the CSF relative to the blood) that comprised more than 70% of the expanded CSF-enriched T cells. Several different strategies were undertaken (Fig. 4a). An unbiased antigen discovery approach was first employed using a peptide:MHC (pMHC) yeast display library in which approximately 1–10 × 108 random peptides are displayed on a given MHC allele for probing recognition against individual TCRs19. Of the 23 CD8+ TCRs, 18 were successfully expressed and tested against specific MHC I allele libraries based on library availability and the alleles of the participants from whom the TCRs were derived. Four TCRs (three MS/CIS and one HC) demonstrated substantial enrichment of specific peptides from three different MHC I libraries (Supplementary Table 12).

a, Individual TCRαβ pairs were cloned into plasmids and expressed in primary human CD8+ T cells by nonviral CRISPR knock-in. Candidate antigens for testing specificity were identified in three parallel strategies, screened by pMHC tetramer binding and validated by cytokine production to cognate antigen. b, Candidate antigens for four TCRs identified by pMHC yeast display (unbiased antigen discovery) were tested for tetramer binding and cytokine reactivity experiments. Data are the mean ± s.e.m. Each peptide was tested a minimum of two times using T cells from different donors for tetramer and cytokine, respectively (RLVWDLETL, n = 6 and 4; RLIFDVPWL, n = 2 (both tests); RLLWDWEFV, n = 3 (both tests); RLVWDLEIL, n = 7 and 6; LVDYAKPPR, n = 6 and 5; RVIWEPEFR, n = 5 and 2; KVMWEPWFK n = 5 and 4; GYEIMLLDY n = 2 and 3; GYDVKELSY n = 2 and 3; CSERNPWTF n = 5 and 4; ATDVGWWWY, n = 5 and 2).
To validate these candidate antigens, each TCR was expressed individually in primary human CD8+ T cells by nonviral CRISPR–Cas9-mediated TCR knock-in (Extended Data Fig. 5a). Candidate TCR-expressing CD8+ T cells were then probed for antigen specificity using pMHC I tetramers loaded with peptides identified from the yeast display library screen. Three of the four tested TCRs demonstrated robust tetramer binding to most or all of the library-identified peptides (Fig. 4b and Extended Data Fig. 5b). The ability of CD8+ T cells expressing these TCRs to respond functionally to the same antigens was tested by intracellular cytokine stimulation using antigen-presenting cells (APCs) expressing the relevant MHC I allele. Strikingly, only TCR clonotype 54189_65570 demonstrated cytokine production to peptide CSERNPWTFY; none of the other TCR-expressing CD8+ T cells were functionally responsive to the respective yeast display-derived peptides (Fig. 4b). As nearly all of the yeast display peptides identified by pMHC I tetramers were not naturally occurring (that is, mimotopes), the analysis was extended to an array of foreign and human peptide homologs (Supplementary Table 12). Varying degrees of tetramer binding were observed depending on the TCR tested but none of the peptide homologs elicited cytokine responses above background (Extended Data Fig. 6a,b). Thus, although the unbiased antigen discovery approach yielded novel mimotopes of several CD8+ T cell clonotypes detectable by pMHC I tetramer binding, none exhibited functional reactivity to naturally occurring antigens.
Probing viral specificity of clonally expanded CD8+ T cells
The highly expanded CSF-enriched TCR clonotypes were queried against several public TCR databases, including VDJdb20, TCRex21 and TCRmatch22, as an additional TCR antigen discovery strategy (Fig. 4a). One CD8+ T cell clonotype (86333_1456) from participant MS8 demonstrated an exact match to both TCRα and -β sequences with a well-described Epstein–Barr virus (EBV) epitope, EBNA3A193–201 (FLRGRAYGL; Supplementary Table 13), which is restricted by HLA-B*08:01, an allele carried by this individual (Supplementary Table 1). This identical clonotype was also moderately expanded in the CSF from an individual with Alzheimer’s disease17. A second CD8+ T cell clonotype (69317_24418) from participant MS6 was a near-exact match to a TCR specific for the EBV epitope BZLF154–64 (EPLPQGQLTAY) restricted by HLA-B*35:01, an allele also carried by this individual.
These TCRs were expressed in primary human CD8+ T cells as described earlier and their specificity was again tested by pMHC I tetramer analysis. TCR 86333_1456 and TCR 69317_24418 showed robust tetramer staining to EBNA3A193–201:B*08:01 and BZLF154–64:B*35:01, respectively (Fig. 5a). To confirm functional reactivity, primary human CD8+ T cells expressing each of these TCRs were stimulated with APC lines expressing cognate HLA and loaded with or without cognate EBV peptide. Each TCR demonstrated clear cytokine production to the relevant EBV peptide (Fig. 5b,c), confirming both CSF-expanded and enriched CD8+ T cell clonotypes are specific to EBV antigens.

a,b, Representative flow cytometry analysis of tetramer binding (a) and cytokine production (b) of three TCRs (from patients with MS) with predicted reactivity to four different viral epitopes. The percentage of cells in the gated regions are indicated. c, Percentage tetramer binding and cytokine reactivity of each TCR. Cytokine reactivity reflects the subtracted background from the no-stimulation control. Data are the mean ± s.e.m.; TCR 86333_1456 FLRGRAYGL, n = 5 tetramer and 3 cytokine; TCR 69317_24418 EPLPQGQLTAY, n = 11 tetramer and 9 cytokine; TCR 86333_17042 VTEHDTLLY and TCR 86333_17042 FLRGRAYGL, n = 2 (all groups). d, Frequencies and degree of enrichment of the three EBV-specific clonotypes (highlighted in red) relative to all other highly enriched and expanded T cell clonotypes. e, TCR sequencing alignment of expanded CD8+ TCRs to EBV- and CMV-specific TCRs in the peripheral blood (PB) and CSF. f, EBV-specific TCR alignment of all expanded CD8+ T cell clonotypes in the PB and CSF of MS/CIS and HC/OND study participants. g,h, Summary of functional reactivity of Jurkat cells expressing the indicated TCR specific for EBV EBNA3A193–201:B*08:01 (g) or EBV BZLF154–64:B*35:01 (h) to the indicated peptides (n = 3 EBV peptides and 2 peptide homologs). Responses reflect the mean ± s.e.m. frequency of CD69 and NFAT–mCherry double-positive cells with the no-stimulation background control subtracted. Amino-acid differences between cognate EBV peptides (leftmost of each plot) and self-peptide homologs are indicated in red. Each peptide was tested in a minimum of two independent experiments.
In light of these findings, the possibility that additional CSF-enriched and expanded CD8+ T cells may be specific for viral antigens, in particular EBV, was further explored. Note that severe acute respiratory syndrome coronavirus 2 peptides were not tested as all samples were collected previous to the coronavirus disease 2019 pandemic. Nineteen TCRs were tested against panels of pMHC I tetramers loaded with previously identified immunodominant viral epitopes restricted by HLA matching that of the TCR donors. A total of 98 peptides restricted by eight different MHC I alleles were screened (Supplementary Table 14). Each TCR was screened with individual pMHC tetramers, except in the case of HLA-A*02:01 where tetramers were pooled in groups of five due to the large number of candidate peptides. Each TCR was tested against the indicated peptides a minimum of two times using two different T cell donors for TCR expression. No specific tetramer signal was observed for any of the TCRs to any of the peptides beyond the two EBV epitopes already identified for TCRs 86333_1456 and 69317_24418 (Extended Data Fig. 7). Although TCR 86333_17042 from participant MS8 showed an identical match for a TCRβ sequence specific for EBV and cytomegalovirus (CMV) antigens with corresponding MHC I alleles (Supplementary Table 13), it did not show any notable tetramer binding or cytokine reactivity to either viral antigen (Fig. 5a–c).
Potential reactivity to EBV was further assessed for the other CSF-expanded and enriched CD8+ T cells given the EBV reactivity of two clonotypes. EBV-transformed lymphoblastoid cell lines (LCLs) were employed to survey a wide array of processed EBV epitopes across a multitude of HLA alleles. NFAT–mCherry-expressing Jurkat cells transfected with the CD8 co-receptor and a single candidate TCR were co-cultured with partially HLA-matched LCLs. Fully HLA-mismatched LCLs and TCR-expressing Jurkat cells from HLA-mismatched patients were used as negative controls. This enabled testing of 16 additional candidate TCRs against at least two different LCLs matching 3–6 MHC I alleles (Supplementary Table 15). Almost all TCRs showed no detectable reactivity; however, TCR 94669_8198 from patient MS27 demonstrated a clear reproducible response to LCLs only when matching the HLA-A*29:02 allele (Fig. 6a–c). No response was elicited from primary B cells from the same donor used to generate the LCLs, indicating this is very likely to be an EBV-specific response rather than a B cell self-antigen or alloreactive response. To identify a potential specific EBV epitope, Jurkat reporter cells expressing TCR 94669_8198 were tested against seven candidate EBV peptides identified from The Immune Epitope Database (FLYALALLL, VFGQQAYFY, AYSSWMYSY, FVYGGSKTSLY, VFSDGRVAC, VSSDGRVAC and ILLARLFLY) presented by HLA-A*29:02-expressing APCs. No functional response was elicited, however, indicating reactivity to a still unspecified EBV epitope (Extended Data Fig. 8).

a, Representative flow cytometry analysis of Jurkat reporter cells expressing the indicated TCR and CD8 co-receptor that were co-cultured with partially HLA-matched (matching allele indicated in red) EBV-transformed LCLs. Reactivity was assessed by coexpression of CD69 and NFAT–mCherry. Fully HLA-mismatched LCLs and mismatched TCR-expressing Jurkat cells were used as negative controls. a,b, The percentage of cells in the gated regions is indicated. b, Representative flow cytometry analysis of Jurkat reporter cells expressing TCR 94669_8198 were co-cultured with LCLs or primary uninfected B cells from the same donor. c, Summary of all candidate TCRs tested and the corresponding matching MHC I alleles expressed by different LCL lines. The mCherry+CD69+ signal of a given TCR-expressing Jurkat cell line co-cultured with partially MHC-matched LCLs was normalized to the signal observed from completely MHC-mismatched LCLs (left) or mismatched TCR-expressing Jurkat cells (right), which was reported as fold change (FC).
We also explored EBV specificity for CD8+ T cell clonotypes that were aligned to the highly CSF-expanded and enriched CD8+ T cell clonotypes that were EBV-reactive (Fig. 3b). Only GLIPH2-derived TCR sequences from CD8+ T cells that shared the same MHC I allele as that of the aligned EBV-specific clonotype were tested (Supplementary Table 16). Unlike the EBV-specific clonotype 86333_1456, the GLIPH2-aligned TCRs 86333_17042 and 86333_18519 (all from MS8) showed no detectable reactivity to EBNA3A peptide FLRGRAYGL restricted by HLA-B*08:01 (Fig. 3c). TCR 53778_13077 from MS10 was aligned by GLIPH2 to TCR 69317_24418 from MS6, specific for the BZLF1 B*35:01-restricted peptide EPLPQGQLTAY. Strikingly, TCR 53778_13077 was found by VDJdb search to exactly match a TCR previously demonstrated to be specific for EPLPQGQLTAY23. This specificity was validated by stimulating Jurkat reporter cells expressing TCR 53778_13077 with or without EPLPQGQLTAY presented by HLA-B*35:01-expressing APCs. Notably, TCR 53778_13077 was moderately expanded in the CSF (0.35%) and enriched approximately threefold relative to the blood of MS10 (Supplementary Table 2).
These findings indicate that at least three highly expanded CD8+ T cells in the CSF of patients with MS are specific for EBV, but the specificities for most of the enriched T cell clonotypes remain unknown (Fig. 5d). The overwhelming majority of clonotypes were not enriched in the CSF of the 18 study participants (Fig. 2b and Supplementary Table 2) or the three patients with MS and EBV-specific clonotypes (Extended Data Fig. 9a). To assess whether EBV specificity among expanded CD8+ T cells in the CSF was overall enhanced compared with the blood, TCR sequencing alignment (identical V genes, J genes and CDR3 amino-acid sequences for paired TCRα and -β chains) was performed against all expanded CD8+ TCR sequences (>1 TCR per clonotype) in VDJdb20 with CMV used as a comparison. EBV- and CMV-aligned CD8+ TCR sequences in the blood were very similar; however, EBV specificity was markedly increased in the CSF, whereas no CMV specificity was found (Fig. 5e). When the EBV-aligned CD8+ TCR sequences of the MS/CIS and HC/OND groups were compared, EBV-specific TCR alignment was only observed in the patients with MS/CIS (Fig. 5f). This provides additional support that EBV-specific CD8+ T cell expansion is uniquely increased in the CSF in MS.
Transcriptional profiles of EBV-specific CD8+ T cells
CD8+ T cells of different viral specificities can exhibit distinct phenotypic characteristics24. The transcriptional profiles of the three CSF-expanded CD8+ T cell clonotypes were therefore compared against all other CSF-expanded and enriched CD8+ T cells. Differential gene expression analysis revealed three genes that were significantly increased in the EBV-specific CD8+ T cells, most notably CXCR5 (Supplementary Table 17), which is associated with migration to B cell follicles and control of chronic infections25. Specific genes associated with memory differentiation, migration and tissue residency were also compared. Consistent with previous reports24, CD27 was particularly abundant in the expanded EBV-specific CD8+ T cells (Extended Data Fig. 9b). In addition, KLF2, CXCR4, S1PR1 and CCL4 were more abundant in EBV-specific CD8+ T cells. In contrast, CXCR3, CD69 and CCL5 were more abundant in non-EBV-specific expanded CD8+ T cells. These findings therefore indicate a distinct phenotype of CSF-expanded CD8+ T cells that are specific for EBV. Rather than expressing TRM markers and genes associated with lymphocyte recruitment, these findings suggest that EBV-expanded CD8+ T cells in the CSF are an effector population associated with follicular homing and B cell interactions.
Lack of self-antigen cross-reactivity of EBV-specific CD8+ T cells
To determine whether the two EBV peptide-reactive CD8+ T cell clonotypes may be cross-reactive against self-antigens, the TCRs were screened against panels of self-peptides with partial sequence homology (Supplementary Table 18). Using NFAT–mCherry-expressing Jurkat cells transfected with the CD8 co-receptor and TCR 86333_1456 or 69317_24418, high reactivity to the respective EBV peptides was confirmed (Fig. 5g,h). Strikingly, no notable reactivity was observed for any of the self-peptide homologs. Although this does not entirely exclude the possibility for self-antigen cross-reactivity, it raises the possibility that the CSF enrichment of these clonally expanded CD8+ T cells may be driven by reactivity to EBV.
Presence of EBV in cerebrospinal fluid
To assess for the presence of EBV in CSF, DNA was extracted from the CSF of all study participants and PCR amplified with primers specific for the EBV BZLF1 gene (Extended Data Fig. 10a). The PCR amplicons were Sanger sequenced for further confirmation (Supplementary Table 19). In this manner, EBV DNA was detected in 6/13 MS/CIS samples and 2/5 HC/OND samples (Supplementary Table 20), including patients MS6 and MS8 who also harbored highly expanded EBV-reactive CD8+ T cells in their CSF. The presence of EBV DNA was further quantified by droplet digital PCR (ddPCR) via amplification of the EBER2 gene normalized to a housekeeping gene. EBV was detected in the CSF of nearly all patients and control study participants, although the relative abundance varied widely with the highest levels found in patients with MS/CIS (Fig. 7a and Extended Data Fig. 10b). EBV transcripts to several latent and lytic genes were also assessed by complementary DNA quantification. EBER2 cDNA was overall less detectable than DNA and there was no significant difference between MS/CIS and HC/OND (Fig. 7a,b). EBNA3A (latency III gene) and BZLF1 (early lytic gene) were mostly undetectable with no significant difference between the two cohorts (Fig. 7b). Strikingly, a significant increase was observed in BamHI-W transcripts in the MS/CIS cohort, including patients MS6, MS8 and M27 with highly expanded EBV-specific CD8+ T cells in CSF. This therefore suggests that EBV reactivation is enhanced in the CSF in patients with MS/CIS, which may drive the expansion of EBV-specific CD8+ T cells.

a, Summary of EBV DNA ddPCR results from CSF supernatant in which EBER2 was normalized to a housekeeping gene (MS/CIS, n = 13; HC/OND, n = 5). b, EBV cDNA for each of the indicated genes were measured by ddPCR and normalized to a housekeeping gene. Each sample was run in duplicate and each dot represents the average result from each study participant. Data are the mean ± s.e.m. MS/CIS and HC/OND samples were compared using an unpaired two-tailed Student’s t-test with Welch’s correction; NS, not significant; n = 13 for MS/CIS for all genes except EBER2 where n = 12 due to lack of sufficient sample for MS27 and n = 5 in HC/OND for all genes except BamHI-W where n = 4 due to a lack of sufficient sample for OND4.