Leonardo da Vinci is one of the most iconic figures of the Italian Renaissance. He created one of the most recognisable works in the history of art, La Gioconda, the portrait of Lisa Gherardini about which thousands of pages have been written, not all of them with the same basis. It is curious that, even though only 17 of his paintings have been preserved, this is usually the best-known facet of Leonardo. Or perhaps it is not so curious if we stop to look closely at other works, such as The Last Supper.

Personally, I am much more fascinated by his work as a scientist and inventor. He was one of the first people in history to approach the study of science from an observational and experimental perspective. This allowed him to study the world around him in detail and, using his great artistic ability, to capture it all in many illustrated manuscripts.
His anatomical studies were meticulous, including the drawing of bones, muscles, organs, and even the circulatory system in great detail. Among his inventions and technological developments, he conceptualised many pioneering ideas, such as various flying machines, weapons of war, hydraulic systems and meteorological measurement systems. He also developed theoretical knowledge in the fields of optics, geology, and botany.

You will have read about all this many times. But with such an extensive professional resume, it is perhaps not surprising that there are aspects of his life that are not commonly discussed. So, naturally, today I will focus on his exceptional skills as a mapmaker.
It is difficult to pinpoint the moment when Leonardo discovered his interest in geography and the representation of territory on maps. Perhaps there was no turning point as such, but rather a growing interest like many others in the life of such a curious and productive person. What does seem to have played an important role was the fact that he was born in Tuscany, in Vinci, and that his family moved to Florence during his childhood in the 1460s. At that time, Paolo dal Pozzo Toscanelli, a scholar who devoted much of his time to understanding perspective, was living there, which may have influenced Leonardo in his work on perspective. Yes, the same Toscanelli who drew the map that partly motivated Christopher Columbus’s voyage.
One of Leonardo’s earliest known landscapes, that of the Arno River valley in Tuscany, already wonderfully combines his understanding of perspective, his interest in the geography of his surroundings, and his skills to represent it on paper.

If we continue searching among his early drawings on the subject of perspective, compiled in the Codex Atlanticus, we find this one from 1480. Leonardo da Vinci could have chosen a more artistic object, such as a statue, or a large building, such as a cathedral, with which the idea of perspective would have been much more intuitive. Instead, he opted for an armillary sphere, an object closely linked to geography since ancient times, generally used to represent the cosmos from an earthly perspective. Although it could also be used to show the Earth’s surface, as if it were a globe.

It is essential to bear in mind that, in the second half of the 15th century, maps were mainly portolan charts used by sailors to understand the routes they had to navigate to travel between two points. Or sketches of inhabited places to divide the lands belonging to each ruler. There were some world maps, but most of them were limited to conceptual maps, such as those of T and O maps, or replicas of the world as described by Ptolemy.
Leonardo never wrote a treatise on geography, as Ptolemy did, but his understanding of the territory and the importance of finding effective ways to represent it was far ahead of his contemporaries. I could simply leave you with his collection of maps, and I guarantee you would be fascinated by their beauty. Instead, I am going to limit myself to just three and use them to illustrate how he achieved three crucial advances in the early 16th century that are fundamental to understanding the history of geography.
During the Middle Ages, cities were mainly represented from a bird’s-eye view. Cities had become complex settlements in which importance lay mainly in the buildings that rose above the ground, rather than in the roads and streets that were not represented. Sketches did exist, but these were only used when the relevant thing was to show the way forward, not if the aim was to represent the city as a whole.
These essentially artistic works gained popularity at the end of the 15th century and remained the main way of representing cities for more than two centuries. However, this type of urban plan had a fundamental problem: it represented the uniqueness of the different buildings at the expense of casting shadows on existing streets. In some cases, the perspective was forced to make the existence of a street clear. An example of this can be seen in the fabulous map of Madrid drawn by Teixeira in 1656.

More than a century and a half before Teixeira’s map was published, Leonardo da Vinci had already provided a solution to these limitations. In 1502, Leonardo was working for the House of Borgia as their private architect. They asked him to find out all the available details about the city of Imola, on the outskirts of Bologna, which led Leonardo to create a map of the city.
As we have already seen, Leonardo was a particular person, so he was determined to do the best job possible. He travelled to Imola and walked all the streets, taking detailed measurements of all the buildings, the size of their facades, the layout of the streets and the angles of the intersections. As a result, he drew the first map of a city with a satellite view, with all elements in proportion, and even detailing minor problems with the alignment of the facades.
Despite the value of Leonardo’s innovation in representing cities on maps, this practice was used very sporadically until the late 17th and early 18th centuries. This was partly because urban planning was not a priority for leaders until the late 18th century. Until industrialisation radically changed cities and their inhabitants, mayors were only concerned with ensuring that the city was well protected and that there was a sufficient supply of water.
The map of Imola already hints at the second major innovation that Leonardo da Vinci brought to cartography. If we look closely at the territory surrounding Imola, we can see slight changes in colour intensity. Intuitively, we might understand this to be simply an issue of conservation in a work that is more than 500 years old. This would be true, except that the areas with more intense colours correspond precisely to the highest points in the territory represented.
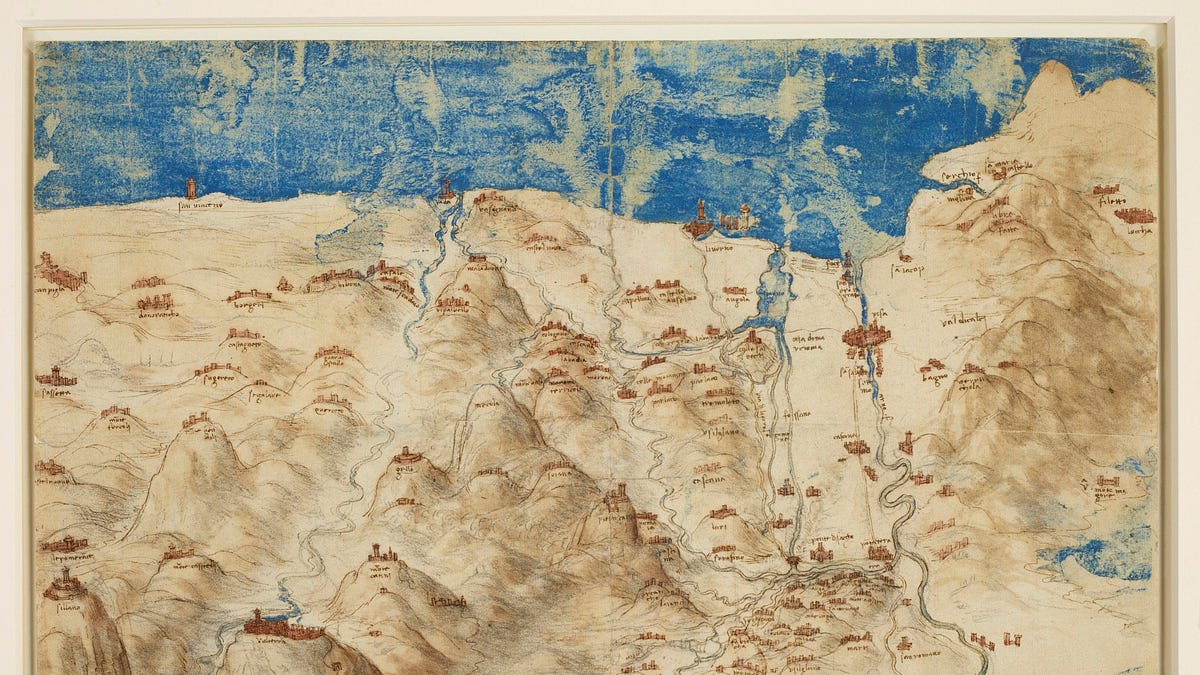
Leonardo also introduced the use of different colour intensities to represent the elevation of the terrain without resorting to bird’s-eye views. This map, which describes the course of the Arno River in central Italy, is perhaps the best example of this concept.

Just by knowing that the darker colours represent the highest points, we can easily tell where the mountain ranges are located. Moreover, it’s possible to identify the valleys through which the different rivers flow, as well as how steep the slopes of the different mountains are.
The use of colours was not limited to overhead maps; Leonardo also used them in bird’s-eye view maps depicting different regions of Tuscany for the House of Borgia. The combination of colour coding and the use of shadows in perspective makes these maps particularly powerful in representing relief. Possibly more effectively than any other cartographer up to that point. I would even go so far as to say that no one surpassed him in this regard in the following two centuries.


Like anyone with an interest in geography who lived during the Age of Discovery, Leonardo was also interested in the shape of the world. Despite this, he is not usually recognised as the author of any significant world map, partly because he did not author any world map that marked a turning point, as other world maps of the 16th century did.
Nevertheless, among his papers, this fabulous representation of the world divided into eight circular triangles of equal size was found.

This map went completely unnoticed until it was first documented by Richard Henry Major. Major was a geographer and map curator who worked for 36 years as curator of the British Museum’s map collection, from 1844 to 1880. In 1865, he published an article about this map, in which he claimed that its author was Leonardo da Vinci and that it was the first map to refer to America.
This claim has been the subject of much debate among scholars of cartography and Leonardo’s life. There has never been a consensus, but the evidence that has been provided over the years tips the balance in favour of Leonardo’s authorship. Among other things, as Christopher Tyler states, there are references to this projection and this map in other plates compiled in the Codex Atlanticus, whose authorship is not doubted by any academic.

The map is usually dated to around 1514, as it makes direct reference to Florida, which was discovered by Ponce de León in 1513, but it is represented as an island, Terra Florida, a confusion that lasted for a very limited time.
Interestingly, the map also correctly depicts the North Pole as a large body of water and the South Pole as a large land mass, corresponding to the Arctic Ocean and Antarctica. Despite getting these two aspects right, both estimates were entirely coincidental, as at the beginning of the 16th century we were far from really knowing the poles.
What does seem reliable is all the information included on his map about Asia, where he shows India, Indochina, Japan, and even the eastern tip of Russia in considerable detail and with reasonable accuracy, all in acceptable proportions. This indicates that he may have had access to information about the explorations of various sailors, either directly or indirectly.
By popular demand, here’s a button for procrastinating, in case you have plenty of things to do, but you don’t feel like. Each time you click on it, it will take you to a different map from the more than 1,100 in the catalogue.
If you like what you read, don’t hesitate to subscribe to receive an email with each new article that is published.